Quantcast
Channel: Languages – AMIS Technology Blog | Oracle – Microsoft Azure
Viewing all 163 articles
Browse latest View live

Calling out from Java to JavaScript (with call back) – leveraging interoperability support of GraalVM

$
0
0

imageInteroperability from Java to JavaScript has been an objective for the Java community for quite a while. With Rhino and later Nashorn, two valiant attempts were made to add scripting interaction to the JDK and JVM. Now, with GraalVM, there is a better alternative for running JavaScript code from within Java applications. The interaction itself is faster, more robust and more ‘native’ (rather than bolt-on). For developers, the interaction is easier to implement. And as a bonus: the interaction that GraalVM allows from Java to JavaScript is also available for any other language that the GraalVM runtime can handle – including R, Ruby, Python and LLVM (C, C++, Rust, Swift and others).

By picking GraalVM 1.0 (based on JDK 8) as the runtime environment you enable the interoperability from Java to any of the languages GraalVM can run. No additional setup is required to interact with JavaScript; if you want to call out to Python, you first need to install graalpython.

On November 19th 2019 we will see the release of GraalVM 19.3 with support for Java 11. Note: GraalVM can be injected into your Java VM as the JIT Compiler of choice, bringing performance enhancements to most modern Java applications.

In this article, I will discuss a number of intricacies encountered when making Java code talk to JavaScript code. In slightly increasing levels of complexity, I will show:

  • Evaluate JavaScript code snippets
  • Load JavaScript sources from separate files and invoke functions defined in them
  • Exchange data and objects back and forth between Java and JavaScript
  • Allow JavaScript code called from Java to callback to Java objects
  • Run multiple JavaScript threads in parallel

In a follow up article I will go through the steps of making the functionality of a rich NPM module available in my Java application. And after that, I will discuss the route in the other direction in a further article: calling Java from a Node(NodeJS) or JavaScript application.

I will assume that the GraalVM (19.2.1 – release in October 2019) runtime environment has been set up, and take it from there. Sources for this article are in GitHub: https://github.com/AMIS-Services/jfall2019-graalvm/tree/master/polyglot/java2js 

1. Evaluate JavaScript code snippets

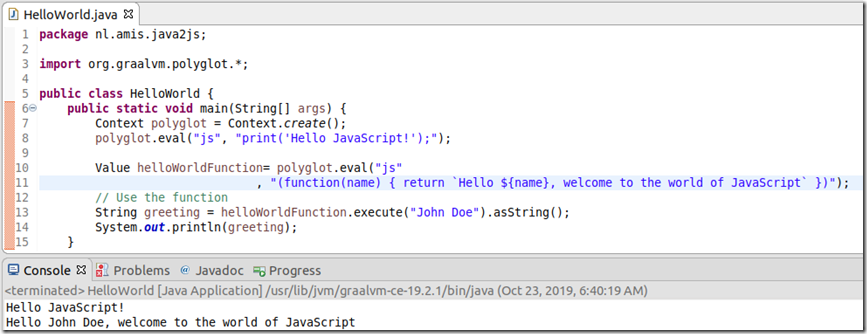
The Graal package org.graalvm.polyglot contains most of what we need for the interaction from Java to other languages. Using the Context class from that package, we have to setup a Polyglot Context in our code. We can then use this context to evaluate any snippet of code – in this case a snippet of js (meaning JavaScript or ECMA Script). The print command in this snippet is executed as System.out.println – printing the string to the system output.

When the snippet evaluation results in an object – for example a function as in line 10 of the sample – then this object is returned to Java as a Polyglot Value. Depending on the type of the Value, we can do different things with it. In this case, because the JavaScript code resolved to function, the Polyglot Value in variable helloWorldFunction can be executed, as is done in line 13. The input parameters to te executable object are passed as parameters to the execute method on the Value and the result from the execution is once again a Polyglot Value. In this case, the type of the Value is String and we can easily cast it to a Java String.

image

2. Load JavaScript sources from separate files and invoke functions defined in them

Instead of polluting our Java sources with inline JavaScript (bad practice in my view), we can load JavaScript sources from stand alone files and have them evaluated. Subsequently, we can access the data objects and functions defined in those files from Java code.

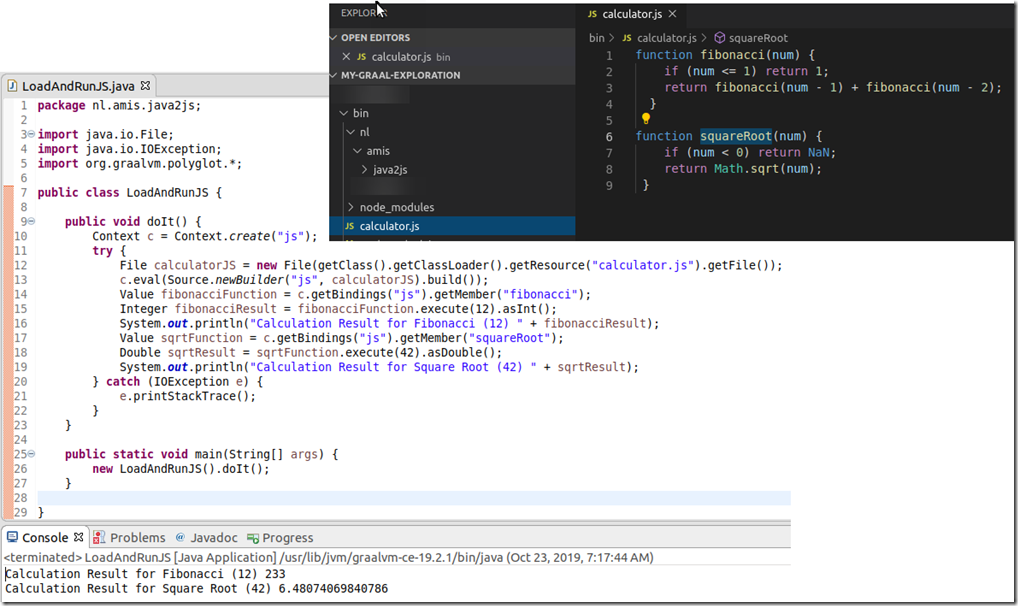
Again, a Polyglot Context is created. Next, a File object is defined for the JavaScript source file (located in the root directory of the Java application). The eval method on the context is executed on the File object, to load and evaluate the source code snippet. This will add the two functions fibonacci and squareRoot to the bindings object in the Polyglot Context. This object has entries for the objects that are evaluated from inline snippets and evaluated source files alike. Note that we can evaluate more File objects – to load JavaScript functions and data objects from multiple files.

Next we can retrieve the function object from the bindings object in the context and execute it.

image

3. Exchange data and objects back and forth between Java and JavaScript

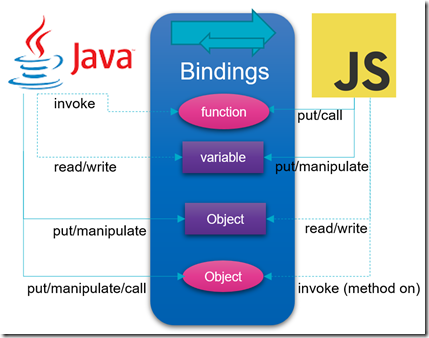
Between the worlds of Java and JavaScript, there is a polyglot middle ground, an interface layer that can be accessed from both sides of the language fence. Here we find the bindings object – in a bilateral interaction. This bindings object may be used to read, modify, insert and delete members in the top-most scope of the language. We have seen the bindings object already as the map that stores all functions that result from evaluating JavaScript sources loaded into our Polyglot context in Java.

(Note: In addition, there is a polyglot bindings objects that may be used to exchange symbols between the host and multiple guest languages. All languages have unrestricted access to the polyglot bindings. Guest languages may put and get members through language specific APIs)

image

There are several different situations we could take a look at. For example: when a snippet of JavaScript is evaluated, any function or object it defines is added to the Bindings object and is therefore accessible from Java. A simple example of this is shown here, where the JavaScript snippet defines a constant PI, that subsequently becomes accessible from Java:

image

and the output from the Java program:

image

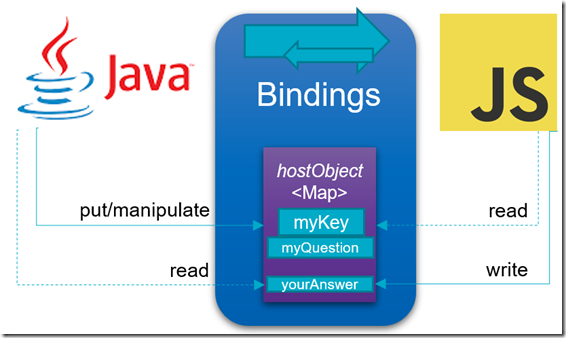
Here is an example of Java preparing a Java Map and putting this Map in Bindings in a way (as ProxyObject) that makes it accessible as ‘regular’ JavaScript object to JavaScript code. The JavaScript code reads values from the Map and also adds a value of its own. It could also have changed or removed entries in or from the Map. The Map is effectively open to read/write access from both worlds – Java and JavaScript:

image

image

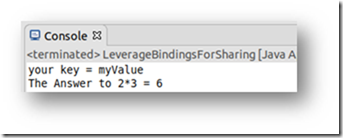
And the system output:

image 

The next example has a file with data in JSON format that is loaded as JavaScript resource. The data is subsequently accessed from Java.

image

The way we have to deal with arrays across language boundaries is not super smooth. It can be done – and perhaps in a better way than I have managed to uncover. Here is my approach – where the JavaScript file is loaded and evaluated, resulting in the countries object – a JavaScript array of objects – being added to the bindings object. When retrieved in Java from the bindings object, we can check for ArrayElements on the Polyglot Value object and iterate through the ArrayElements. Each element – a JavaScript object – can be cast to a Java Map and the properties can be read:

image

The output:

image

Note: here is what the file looks like. It is not plain JSON – it is JavaScript that defines a variable countries using data specified in JSON format – and copy/pasted from an internet resource:

image

4. Allow JavaScript code called from Java to call back to Java objects

If we place Java Objects in Bindings – then methods on these objects can be invoked from JavaScript. That is: if we have specified on the Class that methods are ‘host accessible’. A simple example of this scenario is shown here:
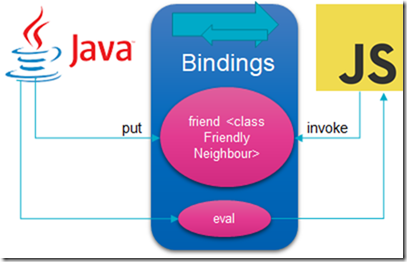
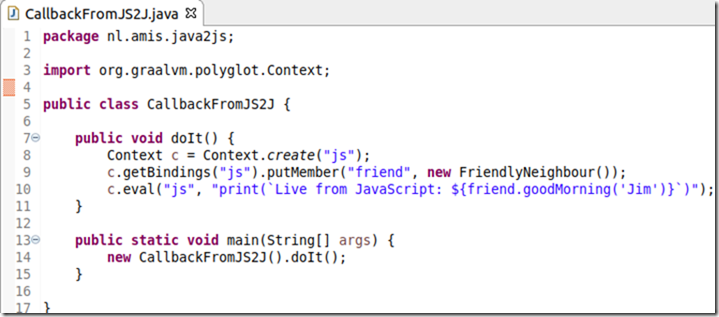
imageOur Java application has created an object from Class FriendlyNeighbour, and added this object to Bindings under the key friend. Subsequently, when a JavaScript snippet is executed from Java, this snippet can get access to the friend object in the Bindings map and invoke a method on this object.

The code for the Java Application is shown here:

image

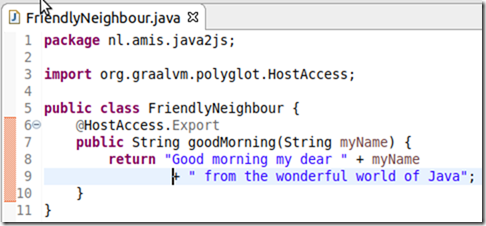
The class FriendlyNeighbour is quite simple – except for the @HostAccess annotation that is required to make a method accessible from the embedding language.

image

The output we get on the console should not surprise you:

image

This demonstrates that the JavaScript code invoked from Java has called back to the world of Java – specifically to a method in an object that was instantiated by the Java Object calling out to JavaScript. This object lives on the same thread and is mutually accessible. The result from calling the Java object from JS is printed to the output and could of course also have been returned to Java.

5. Run multiple JavaScript threads in parallel

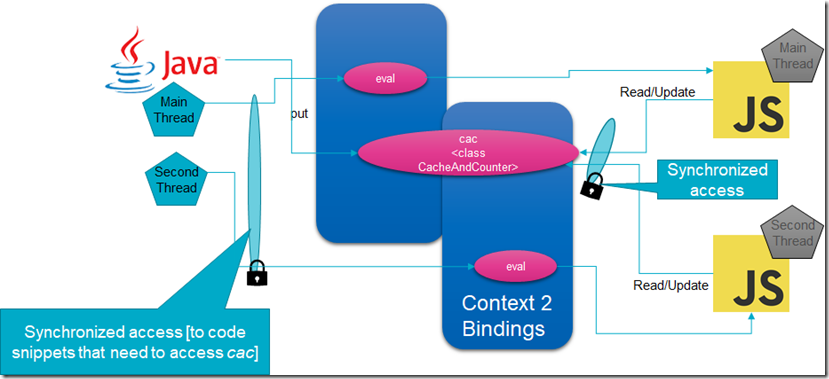
Multiple JavaScript contexts can be initiated from the Java application. These can be associated with parallel running Java threads. Indirectly, these JavaScript contexts can run in parallel as well. However, they cannot access the same Java object without proper synchronization in Java.

In this example, the Java Object cac (based on class CacheAndCounter) is created and added to bindings object in two different JavaScript Context objects. It is the same object – accessible from two JS realms. The two JavaScript contexts can each execute JS code in parallel with each other. However, when the two worlds collide – because they want to access the same Java Object (such as cac) – then they have to use synchronization in the Java code to prevent race conditions from being possible.

image

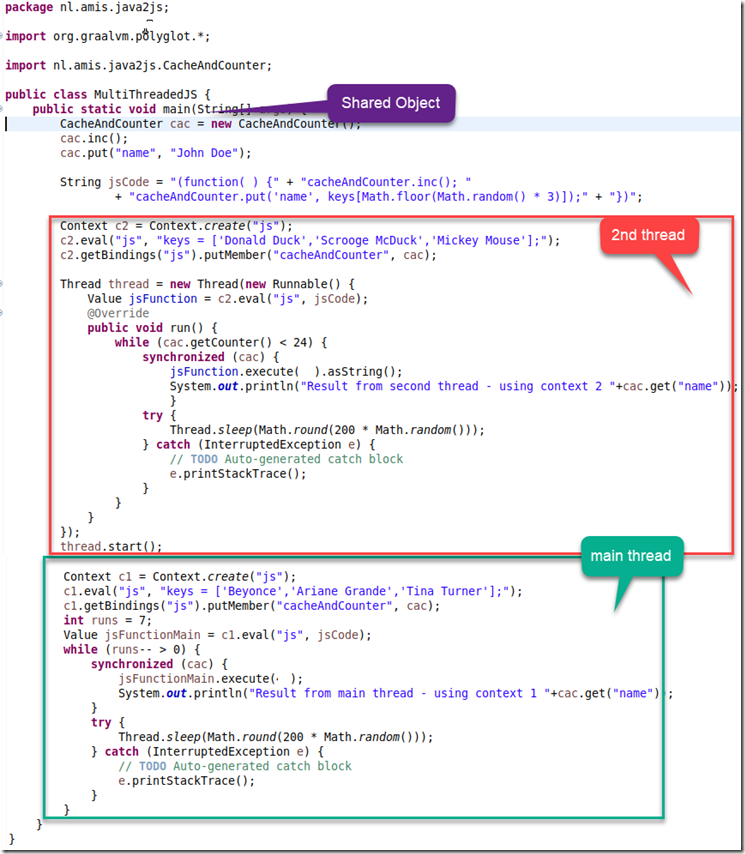
Here is a somewhat complex code snippet that contains the creation of two threads that both create a JavaScript context using the same JavaScript code (not resulting the same JavaScript object) and both accessing the same Java object – object cac that is instantiated and added to the Binding maps in both JavaScript contexts. This allows the JavaScript “threads” to even mutually interact – but this interaction has to be governed by synchronization on the Java end.

image

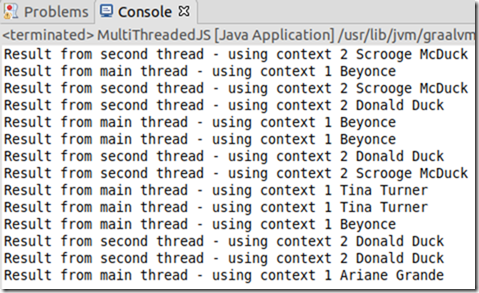
The output shows that the two threads run in parallel.  They both have a random sleep in their code. Sometimes, the main thread gets in several subsequent accesses of cac and at other times the second thread will get in a few rounds. They both access the same object cac from their respective JavaScript contexts – even these contexts are separate. We could even have one JavaScript context interact with the second JavaScript context – which is running through a different thread Java thread – through the shared object. image
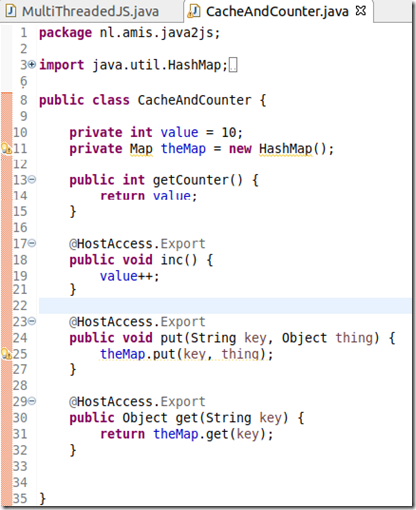
For completeness sake, the salient code from the CacheAndCounter class:

image


Resources

GitHub Repository with sources for this article: https://github.com/AMIS-Services/jfall2019-graalvm/tree/master/polyglot/java2js 

Why the Java community should embrace GraalVM – https://hackernoon.com/why-the-java-community-should-embrace-graalvm-abd3ea9121b5

Multi-threaded Java ←→JavaScript language interoperability in GraalVM  https://medium.com/graalvm/multi-threaded-java-javascript-language-interoperability-in-graalvm-2f19c1f9c37b

#WHATIS?: GraalVM – RieckPIL – https://rieckpil.de/whatis-graalvm/

GraalVM: the holy graal of polyglot JVM? – https://www.transposit.com/blog/2019.01.02-graalvm-holy/

JavaDocs for GraalVM Polyglot – https://www.graalvm.org/truffle/javadoc/org/graalvm/polyglot/package-summary.html

GraalVM Docs – Polyglot – https://www.graalvm.org/docs/reference-manual/polyglot/ 

Mixing NodeJS and OpenJDK – Language interop and vertical architecture -Mike Hearn – https://blog.plan99.net/vertical-architecture-734495f129c4

Enhance your Java Spring application with R data science Oleg Šelajev – https://medium.com/graalvm/enhance-your-java-spring-application-with-r-data-science-b669a8c28bea

GraalVM Archives on Medium – https://medium.com/graalvm/archive

GraalVM GitHub Repo – https://github.com/oracle/graal

GraalVM Project WebSite – https://www.graalvm.org/

The post Calling out from Java to JavaScript (with call back) – leveraging interoperability support of GraalVM appeared first on AMIS Oracle and Java Blog.
Leverage NPM JavaScript Module from Java application using GraalVM

$
0
0

imageInteroperability from Java to JavaScript has been an objective for the Java community for quite a while. With GraalVM, there is great way to run JavaScript code from within Java applications. The interaction itself is faster, more robust and more ‘native’ (rather than bolt-on) than earlier mechanisms. For developers, the interaction is easy to implement. And this opens up great opportunities for leveraging from Java many of the great community resources in the JavaScript community – for example many of the modules available from NPM.

This article shows how the NPM Validator Module – which implements dozens of very useful data validation algorithms – can be hooked into a Java application. With little effort, the Java developer tasked with implementing and endlessly testing several advanced validations is able to make use of what his JavaScript brothers and sisters have produced and shared. Of course the Validator module is just an example – thousands of NPM modules can be woven into Java applications through the polyglot capabilities of GraalVM.

Note: what we can do from Java to JavaScript can also be done to any other language that the GraalVM runtime can handle – including R, Ruby, Python and LLVM (C, C++, Rust, Swift and others). So our Java application can benefit from more than just the JavaScript community. And vice versa: any language that can run on GraalVM can call out to any other language. So the mutual benefit is not restricted to Java making use of other language resources – it works in all directions.

By picking GraalVM 19.2.1 (based on JDK 8) as the runtime environment you enable the interoperability from Java to any of the languages GraalVM can run. No additional setup is required to interact with JavaScript. On November 19th 2019 we will see the release of GraalVM 19.3 with support for Java 11.

In an earlier article, I have given an introduction to the interoperability from Java to JavaScript. I will now build on that article as my foundation, so I will assume the reader knows about GraalVM polyglot, how to evaluate JavaScript code snippets in Java, how to load JavaScript sources from separate files and invoke functions defined in them and how to exchange data and objects back and forth between Java and JavaScript. With that knowledge in place, what we are about to do in this article is a piece of cake or a cup of peanuts.

Sources for this article are in GitHub: https://github.com/AMIS-Services/jfall2019-graalvm/tree/master/polyglot/java2js

The Challenge

I am developing a Java application. I need to perform validations on input data: Postal Code (various countries), Mobile Phone Numbers (many countries), Email Address, Credit Card Number etc.

In simplified pseudo code:

imageimage

I need to implement (or get my hands on) the postalCode Validator – for starters.

The NPM Module Validator offers most of these OOTB (Out of the Box)

image

image

But… it is written in JavaScriptimage

How could that possibly help me?

GraalVM to the rescue.

The Solution

Spoiler alert: here comes the end result. This is the final code, after integrating NPM Module Validator into my Java application:

image

The major changes are: I retrieve an implementation for the postalCodeValidator from somewhere and I can invoke it. I have not written any code to do the validation of postal codes in 27 different countries. And there is this new package called org.graalvm.polyglot that I import and from which I use classes Context and Value. And finally, there is a resource called validator_bundled.js loaded from file. That resource happens to be the Web Packed bundle created create from all JavaScript resources in NPM module Validator. It is that simple.

Running this code gives me:

image

Implementation Steps

The most important thing I had to figure out was: how to make GraalJS – the JavaScript implementation on GraalVM – work with the module structure in the NPM Validator module. GraalJS does not support require() or CommonJS. In order to make it work with NPM modules – they have to be turned into ‘flat’ JavaScript resources – self-contained JavaScript source file. This can be done using one of the many popular open-source bundling tools such as Parcel, Browserify and Webpack. Note: ECMAScript modules can be loaded in a Context simply by evaluating the module sources. Currently, GraalVM JavaScript loads ECMAScript modules based on their file extension. Therefore, any ECMAScript module must have file name extension .mjs.

The steps to turn an NPM module into a self contained bundle dat GraalVM can process are these:

  • check GraalVM compatibility of NPM module
  • install npx (executable runner – complement to npm which is not included with GraalVM platform)
  • install webpack and webpack-cli
  • install validator module with npm
  • produce self contained bundle for validator module with webpack

When this is done, loading and using validator in Java is the same as with any other JavaScript source – as we will see.

1. Check GraalVM compatibility of NPM module with the GraalVM compatibility check:

image

2. install npx – executable runner – complement to npm which is not included with GraalVM platform

image

3. install webpack and webpack-cli

image

4. install validator module with npm

image

5. produce self contained bundle for validator module with webpack

image

image

#install npx
npm install -g npx 

#install webpack
npm install webpack webpack-cli

#install validator module
npm install validator

#create single bundle for valudator module
/usr/lib/jvm/graalvm-ce-19.2.1/jre/languages/js/bin/npx  webpack-cli --entry=./node_modules/validator/index.js --output=./validator_bundled.js --output-library-target=this --mode=development

#Argument: output-library-target, Choices are : "var", "assign", "this", "window", "self", "global", "commonjs", "commonjs2", "commonjs-module", "amd", "umd", "umd2", "jsonp"

Call Validator Module from Java application

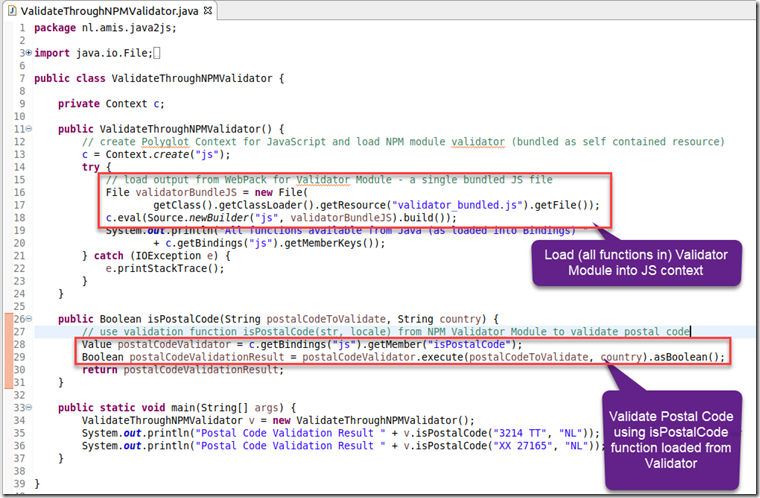
With the Validator module turned into a single self-contained file without non-supported module constructs, we can load this resource into a GraalVM Polyglot context in our Java application running on the GraalVM runtime engine, and invoke any top level function in that context. In order to validate postal codes in Java – here is a very simple code snippet that does just that. Note: the validator_bundled.js is located in the root of our classpath.

image

package nl.amis.java2js;

import java.io.File;
import java.io.IOException;
import org.graalvm.polyglot.*;

public class ValidateThroughNPMValidator {

	private Context c;

	public ValidateThroughNPMValidator() {
		// create Polyglot Context for JavaScript and load NPM module validator (bundled as self contained resource)
		c = Context.create("js");
		try {
			// load output from WebPack for Validator Module - a single bundled JS file
			File validatorBundleJS = new File(
					getClass().getClassLoader().getResource("validator_bundled.js").getFile());
			c.eval(Source.newBuilder("js", validatorBundleJS).build());
			System.out.println("All functions available from Java (as loaded into Bindings) "
					+ c.getBindings("js").getMemberKeys());
		} catch (IOException e) {
			e.printStackTrace();
		}
	}

	public Boolean isPostalCode(String postalCodeToValidate, String country) {
		// use validation function isPostalCode(str, locale) from NPM Validator Module to validate postal code
		Value postalCodeValidator = c.getBindings("js").getMember("isPostalCode");
		Boolean postalCodeValidationResult = postalCodeValidator.execute(postalCodeToValidate, country).asBoolean();
		return postalCodeValidationResult;
	}

	public static void main(String[] args) {
		ValidateThroughNPMValidator v = new ValidateThroughNPMValidator();
		System.out.println("Postal Code Validation Result " + v.isPostalCode("3214 TT", "NL"));
		System.out.println("Postal Code Validation Result " + v.isPostalCode("XX 27165", "NL"));
	}

}

The resulting output:

image

Resources

GitHub Repository with sources for this article: https://github.com/AMIS-Services/jfall2019-graalvm/tree/master/polyglot/java2js

NPM Module Validator

GitHub for GraalJS – https://github.com/graalvm/graaljs

Bringing Modern Programming Languages to the Oracle Database with GraalVM

Presentation at HolyJS 2019 (St Petersburg, Russia): Node.js: Just as fast, higher, stronger with GraalVM

Docs on GraalJS and Interoperability with Java – https://github.com/graalvm/graaljs/blob/master/docs/user/NodeJSVSJavaScriptContext.md

Why the Java community should embrace GraalVM – https://hackernoon.com/why-the-java-community-should-embrace-graalvm-abd3ea9121b5

Multi-threaded Java ←→JavaScript language interoperability in GraalVM  https://medium.com/graalvm/multi-threaded-java-javascript-language-interoperability-in-graalvm-2f19c1f9c37b

#WHATIS?: GraalVM – RieckPIL – https://rieckpil.de/whatis-graalvm/

GraalVM: the holy graal of polyglot JVM? – https://www.transposit.com/blog/2019.01.02-graalvm-holy/

JavaDocs for GraalVM Polyglot – https://www.graalvm.org/truffle/javadoc/org/graalvm/polyglot/package-summary.html

GraalVM Docs – Polyglot – https://www.graalvm.org/docs/reference-manual/polyglot/

Mixing NodeJS and OpenJDK – Language interop and vertical architecture -Mike Hearn – https://blog.plan99.net/vertical-architecture-734495f129c4

Enhance your Java Spring application with R data science Oleg Šelajev – https://medium.com/graalvm/enhance-your-java-spring-application-with-r-data-science-b669a8c28bea

Awesome GraalVM: Create a Java API on top of a JavaScript library

GraalVM Archives on Medium – https://medium.com/graalvm/archive

GraalVM GitHub Repo – https://github.com/oracle/graal

GraalVM Project WebSite – https://www.graalvm.org/

The post Leverage NPM JavaScript Module from Java application using GraalVM appeared first on AMIS Oracle and Java Blog.

Oracle Database: Write arbitrary log messages to the syslog from PL/SQL

$
0
0

Syslog is a standard for message logging, often employed in *NIX environments. It allows separation of the software that generates messages, the system that stores them, and the software that reports and analyzes them. Each message is labeled with a facility code, indicating the software type generating the message, and assigned a severity level.

In *NIX systems syslog messages often end up in /var/log/messages. You can configure these messages to be forwarded to remote syslog daemons. Also a pattern which often seen is that the local log files are monitored and processed by an agent.

Oracle database audit information can be send to the syslog daemon. See for example the audit functionality. If you however want to use a custom format in the syslog or write an entry to the syslog which is not related to an audit action, this functionality will not suffice. How to achieve this without depending on the audit functionality is described in this blog post. PL/SQL calls database hosted Java code. This code executes an UDP call to the local syslog. You can find the code here.

Syslog functionality

There are different ways to send data to the syslog.

  • By using the logger command
  • Using TCP
  • Using UDP

You can execute shell commands from the Oracle database by wrapping them in Java or C or by using DBMS_PIPE (see here). When building a command-line however to log an arbitrary message, there is the danger that the message will contain characters which might break your logger command or worse, do dangerous things on your OS as the user running your database. You can first write a file to a local directory from the database and send that using the logger command, but this is a roundabout way. Using UDP and TCP is more secure and probably also performs better (although I haven’t tested this).

TCP in contrast to UDP works with an acknowledgement of a message. This is done in order to provide the sender some confirmation the packet has been received. With UDP, it is ‘fire-and-forget’ for the sender and you do not know if the receiver has received the packet. UDP is faster as you can imagine since no confirmation is send. 

In this example I will be using UDP to send a message to the local syslog. In order to allow this, rsyslog needs to be installed. 

For Fedora this can be done with:

dnf install rsyslog

Next configure UDP access by uncommenting the below two lines in /etc/rsyslog.conf

$ModLoad imudp
$UDPServerRun 514

If the daemon is not running, start it with:

systemctl start rsyslog

If you want to start it on boot, do:

systemctl enable rsyslog

You might have to configure your firewall to allow access from localhost/127.0.0.1 to localhost/127.0.0.1 UDP port 514

Java in the Oracle Database

The Oracle database has out of the box packages to do TCP (DBMS_TCP). However there is no such functionality for UDP available. In order to provide this, I’ve written a small Java class. It can be installed using just PL/SQL code. I’ve tried this on Oracle DB 19c (using the following Vagrant box) but it is likely to work on older versions.

Create a testuser

First create a testuser and grant it the required permissions:

create user testuser identified by Welcome01;
/
grant connect,dba,resource to testuser;
/
begin
dbms_java.grant_permission( 'TESTUSER', 'SYS:java.net.SocketPermission', 'localhost:0', 'listen,resolve' );
dbms_java.grant_permission( 'TESTUSER', 'SYS:java.net.SocketPermission', '127.0.0.1:514', 'connect,resolve' );
end;
/

Register the Java code

Now create the Java code under the user TESTUSER. The below code is PL/SQL which can be executed in the database to store and compile the Java code.

SET DEFINE OFF
create or replace and compile
 java source named "SysLogger"
 as

import java.io.*;
import java.net.*;

public class Syslog {

	// Priorities.
	public static final int LOG_EMERG = 0; // system is unusable
	public static final int LOG_ALERT = 1; // action must be taken immediately
	public static final int LOG_CRIT = 2; // critical conditions
	public static final int LOG_ERR = 3; // error conditions
	public static final int LOG_WARNING = 4; // warning conditions
	public static final int LOG_NOTICE = 5; // normal but significant condition
	public static final int LOG_INFO = 6; // informational
	public static final int LOG_DEBUG = 7; // debug-level messages
	public static final int LOG_PRIMASK = 0x0007; // mask to extract priority

	// Facilities.
	public static final int LOG_KERN = (0 << 3); // kernel messages
	public static final int LOG_USER = (1 << 3); // random user-level messages
	public static final int LOG_MAIL = (2 << 3); // mail system
	public static final int LOG_DAEMON = (3 << 3); // system daemons
	public static final int LOG_AUTH = (4 << 3); // security/authorization
	public static final int LOG_SYSLOG = (5 << 3); // internal syslogd use
	public static final int LOG_LPR = (6 << 3); // line printer subsystem
	public static final int LOG_NEWS = (7 << 3); // network news subsystem
	public static final int LOG_UUCP = (8 << 3); // UUCP subsystem
	public static final int LOG_CRON = (15 << 3); // clock daemon
	// Other codes through 15 reserved for system use.
	public static final int LOG_LOCAL0 = (16 << 3); // reserved for local use
	public static final int LOG_LOCAL1 = (17 << 3); // reserved for local use
	public static final int LOG_LOCAL2 = (18 << 3); // reserved for local use
	public static final int LOG_LOCAL3 = (19 << 3); // reserved for local use
	public static final int LOG_LOCAL4 = (20 << 3); // reserved for local use
	public static final int LOG_LOCAL5 = (21 << 3); // reserved for local use
	public static final int LOG_LOCAL6 = (22 << 3); // reserved for local use
	public static final int LOG_LOCAL7 = (23 << 3); // reserved for local use

	public static final int LOG_FACMASK = 0x03F8; // mask to extract facility

	// Option flags.
	public static final int LOG_PID = 0x01; // log the pid with each message
	public static final int LOG_CONS = 0x02; // log on the console if errors
	public static final int LOG_NDELAY = 0x08; // don't delay open
	public static final int LOG_NOWAIT = 0x10; // don't wait for console forks

	private static final int DEFAULT_PORT = 514;

	/// Use this method to log your syslog messages. The facility and
	// level are the same as their Unix counterparts, and the Syslog
	// class provides constants for these fields. The msg is what is
	// actually logged.
	// @exception SyslogException if there was a problem
	@SuppressWarnings("deprecation")
	public static String syslog(String hostname, Integer port, String ident, Integer facility, Integer priority, String msg) {
		try {
			InetAddress address;
			if (hostname == null) {
				address = InetAddress.getLocalHost();
			} else {
				address = InetAddress.getByName(hostname);
			}

			if (port == null) {
				port = new Integer(DEFAULT_PORT);
			}
			if (facility == null) {
				facility = 1; // means user-level messages
			}
			if (ident == null)
				ident = new String(Thread.currentThread().getName());

			int pricode;
			int length;
			int idx;
			byte[] data;
			String strObj;

			pricode = MakePriorityCode(facility, priority);
			Integer priObj = new Integer(pricode);

			length = 4 + ident.length() + msg.length() + 1;
			length += (pricode > 99) ? 3 : ((pricode > 9) ? 2 : 1);

			data = new byte[length];

			idx = 0;
			data[idx++] = '<';

			strObj = Integer.toString(priObj.intValue());
			strObj.getBytes(0, strObj.length(), data, idx);
			idx += strObj.length();

			data[idx++] = '>';

			ident.getBytes(0, ident.length(), data, idx);
			idx += ident.length();

			data[idx++] = ':';
			data[idx++] = ' ';

			msg.getBytes(0, msg.length(), data, idx);
			idx += msg.length();

			data[idx] = 0;

			DatagramPacket packet = new DatagramPacket(data, length, address, port);
			DatagramSocket socket = new DatagramSocket();
			socket.send(packet);
			socket.close();
		} catch (IOException e) {
			return "error sending message: '" + e.getMessage() + "'";
		}
		return "";
	}

	private static int MakePriorityCode(int facility, int priority) {
		return ((facility & LOG_FACMASK) | priority);
	}
}
/

Make the Java code available from PL/SQL

create or replace
procedure SYSLOGGER(p_hostname in varchar2, p_port in number, p_ident in varchar2, p_facility in number, p_priority in number, p_msg in varchar2)
as
language java
name 'Syslog.syslog(java.lang.String,java.lang.Integer,java.lang.String,java.lang.Integer,java.lang.Integer,java.lang.String)';

Test the Java code

DECLARE
  P_HOSTNAME VARCHAR2(200);
  P_PORT NUMBER;
  P_IDENT VARCHAR2(200);
  P_FACILITY NUMBER;
  P_PRIORITY NUMBER;
  P_MSG VARCHAR2(200);
BEGIN
  P_HOSTNAME := NULL;
  P_PORT := NULL;
  P_IDENT := 'Syslogtest';
  P_FACILITY := NULL;
  P_PRIORITY := 1;
  P_MSG := 'Hi there';

  SYSLOGGER(
    P_HOSTNAME => P_HOSTNAME,
    P_PORT => P_PORT,
    P_IDENT => P_IDENT,
    P_FACILITY => P_FACILITY,
    P_PRIORITY => P_PRIORITY,
    P_MSG => P_MSG
  );
END;

Now check your local syslog (often /var/log/messages) for entries like

Oct 26 14:31:22 oracle-19c-vagrant Syslogtest: Hi there

Considerations

TCP instead of UDP

This example uses UDP. UDP does not have guaranteed delivery. You can just as well implement this with TCP. Using TCP you do not require custom Java code in the database but you do require Access Control List (ACL) configuration and have to write PL/SQL (using UTL_TCP) to do the calls to rsyslog. An example on how this can be implemented, can be found here.

Custom audit logging to syslog

Using the Oracle feature Fine Grained Auditing (FGA), you can configure a handler procedure which is called when a policy is triggered. Within this procedure you can call the PL/SQL which does syslog logging. The PL/SQL procedure has a SYS_CONTEXT available which contains information like the user, proxy user and even the SQL query and bind variables which triggered the policy (when using DB+EXTENDED logging).

If you want to store what a certain user has seen, you can use Flashback Data Archive (FDA) in addition to FGA. This feature is available for free in Oracle DB 12c and higher. In older versions this depends on the Advanced Compression option. If you combine the FDA and the FGA, you can execute the original query on the data at a certain point in time (on historic data). You can even store the SYS_CONTEXT in the FDA which allows for a more accurate reproduction of what happened in the past. When using these options, mind the performance impact and create specific tablespaces for the FDA and FGA data.

The post Oracle Database: Write arbitrary log messages to the syslog from PL/SQL appeared first on AMIS Oracle and Java Blog.

Create a Native Image Binary Executable for a Polyglot Java Application using GraalVM

$
0
0

imageGraalVM provides a runtime component that enhances the JVM in several ways. It makes the JIT compilation better. It also allows the JVM to run non-JVM languages such as JavaScript, R, Python, Ruby and LLVM. And it makes it possible for languages running on the JVM to interact – through the polyglot interoperability. Another valuable capability of GraalVM is called native image generation. This feature allows us to use Ahead of Time Compilation of a Java application and create a standalone native executable image that consists of the code that normally is produced by the JIT compiler at runtime including all Java Runtime components required for running the code. In short: a single executable that can  be run on a vanilla Linux environment [with the operating system for which the executable was produced]. The run time environment does not require a separate, pre installed Java runtime.

In case the Java application is actually a Polyglot application – say one that also executes JavaScript – then the native image produced from the application does not just consist of the Java runtime components (referenced as Substrate VM – a minimal and self-contained runtime) but also needs to include the GraalJS JavaScript execution engine to be able to evaluate JavaScript at runtime. If the JavaScript snippets that are executed by the application are embedded inline in the Java source code, we do not need to do anything extra for making that source code available at runtime. However, if the JavaScript sources are loaded from an external file – we need to find a way to pass that file to the binary image at runtime – as it will not be included by the GraalVM native image generator.

In this article I show two simple examples of the generation of a native image – one for a polyglot Java application that only had embedded snippets of JavaScript (and possibly Python and R code) and a second one for an application that loads some JavaScript resources from external resources. This application was introduced in great detail in this article. The sources that application are in GitHub: https://github.com/AMIS-Services/jfall2019-graalvm.

Polyglot Java Application – only embedded polyglot snippets

If the Polyglot Java Application that we want to turn into a native image only used embedded, inline snippets of polyglot code, we can use a straightforward approach. We have to instruct the Native Image generator to include the respective runtimes for each of the languages we want to evaluate snippets of at run time – and the generator will comply. When the binary executable is executed, it has everything it needs to interpret the snippets of ‘polyglot’ code.

For example this application:

imageA Java application that evaluates snippets of code in Python, R and JavaScript.

Our instruction to the GraalVM Native Image producer contains references to each of these languages:

image

$GRAALVM_HOME/bin/native-image -cp ./application-bundle.jar --language:js --language:python --language:R  --verbose -H:Name=myPolyglotApplication  -H:Class=nl.amis.AppStarter

Note: parameter -H:Name specifies the name of the native image. -H:Class indicates the Java Class whose main method is the entry point to the application. This means that when we run the binary executable, we trigger the native code equivalent of what was in that main method.

Note 2: at first, my native image generation failed with this error: Error: Image build request failed with exit status -1. I believe shortage of memory was the cause here. Producing a native image is quite memory intensive, especially when polyglot  is added. I increased the memory size of my VM from 9GB to 16GB – and that helped me get rid of the error.

The native image that gets produced is a  binary executable that contains the natively executable representation of the Java code as well as the literal snippets of Python, JavaScript and R code and the runtime engines for these three languages and of course Substrate VM, the mini runtime engine.

This application can now be run just like any other executable Linux application: ./myPolyglotApplication

When we invoke the executable, we are not aware of the fact that it was originally created from multiple programming languages and leverages multiple runtime engines.


Producing a Native Image for a Polyglot Java that loads Polyglot Resources from External Files

The situation is a little bit more complicated if our application loads some of the Polyglot resources from external files instead of only using embedded, inline snippets. I have created a simple Java application that contains embedded JavaScript snippets and also loads a JavaScript resource (the self contained bundle for the NPM Validator module – as described in this article) at run time. I want to keep the JavaScript code separate from my Java code. The Java application is packaged in a JAR file that contains the JavaScript sources in the root. The Java application reads these resources – using getClass().getResourceAsStream() – at runtime.

image


Unfortunately, this is not good enough for the Native Image. Once the native image is produced, the JAR file is irrelevant. The Native Image generator also does not somehow read all resources from the JAR and embeds these in the native image. What are my options? Well, I guess that I either can manually embed the contents of the validatorbundled.js file in a Java Class to ensure that the string content of the file is part of the Java code that makes it into the binary executable. This would work. And I can perhaps even make this into an automated step into my build pipeline.

Another option – the route I have taken for now – is that the Java Class can load the JavaScript resource in two different ways: as a resource from the JAR file (as previously) or from an absolute path on the local file system – to be specified through a program parameter passed when running the executable.

image

The Java Class is coded as follows:

package nl.amis.java2js;

import java.io.BufferedReader;
import java.io.FileInputStream;
import java.io.IOException;
import java.io.InputStream;
import java.io.InputStreamReader;

import org.graalvm.polyglot.*;

public class ValidateThroughNPMValidator {

	private Context c;

	public ValidateThroughNPMValidator() {
		try {
			// load file validatorbundled.js from root of Java package structure aka root of
			// JAR archive file
			InputStream is = getClass().getResourceAsStream("/validatorbundled.js");
			readAndEvaluateJavaScriptSource(is);
			is.close();
		} catch (IOException e) {
			e.printStackTrace();
		}
	}

	public ValidateThroughNPMValidator(String validatorBundleSourceFile) {
		try {
			// load file validatorbundled.js from root of Java package structure aka root of
			// JAR archive file
			System.out.println("Loading Validator Module from " + validatorBundleSourceFile);
			InputStream is = new FileInputStream(validatorBundleSourceFile);
			readAndEvaluateJavaScriptSource(is);
			is.close();
		} catch (IOException e) {
			e.printStackTrace();
		}
	}

	private void readAndEvaluateJavaScriptSource(InputStream is) throws IOException {
		InputStreamReader isr = new InputStreamReader(is);
		BufferedReader JSreader = new BufferedReader(isr);

		// create Polyglot Context for JavaScript and load NPM module validator (bundled
		// as self contained resource)
		c = Context.create("js");
		ClassLoader classloader = Thread.currentThread().getContextClassLoader();
		// load output from WebPack for Validator Module - a single bundled JS file
		c.eval(Source.newBuilder("js", JSreader, "validatorbundled").build());
		System.out.println("All functions available from Java (as loaded into Bindings) "
				+ c.getBindings("js").getMemberKeys());
		JSreader.close();
		isr.close();
	}
	
	public Boolean isPostalCode(String postalCodeToValidate, String country) {
		// use validation function isPostalCode(str, locale) from NPM Validator Module
		// to validate postal code
		Value postalCodeValidator = c.getBindings("js").getMember("isPostalCode");
		Boolean postalCodeValidationResult = postalCodeValidator.execute(postalCodeToValidate, country).asBoolean();
		return postalCodeValidationResult;
	}

	// pass 
	public static void main(String[] args) {
		for(int i = 0; i < args.length; i++) {
            System.out.println("Args "+i+": "+args[i]);
        }
		// if the filename was passed as startup argument, then load the validator bundle according to that specification
		ValidateThroughNPMValidator v = args.length>0?new ValidateThroughNPMValidator(args[0]):new ValidateThroughNPMValidator();
		System.out.println("Postal Code Validation Result " + v.isPostalCode("3214 TT", "NL"));
		System.out.println("Postal Code Validation Result " + v.isPostalCode("XX 27165", "NL"));
	}

}

The command passed to GraalVM native image generation is the same as before:

$GRAALVM_HOME/bin/native-image -cp ./application-bundle.jar --language:js -H:Name=postalCodeValidator -H:Class=nl.amis.java2js.ValidateThroughNPMValidator --verbose -H:+ReportUnsupportedElementsAtRuntime --allow-incomplete-classpath

The Java application to be turned native is packaged in a JAR file. The JavaScript runtime engine should be included for runtime polyglot purposes. The entry point into the Java application is the main method in class ValidateThroughNPMValidator . The native image to be produced is called postalCodeValidator.

The outcome – after a wait time of several minutes- is a binary executable that contains the JavaScript runtime execution engine – but not yet the Validator module. When the binary executable is invoked, it loads the JavaScript from the path specified and evaluates the code into JavaScript functions that subsequently are invoked by the native code created from the Java source shown overhead.

image

As an aside: on my non-optimized system, the startup time difference between the traditional JIT execution style and the native image is quite staggering: 0.08 vs 4.99 seconds:

image


Resources

GitHub Repository with sources for this article: https://github.com/AMIS-Services/jfall2019-graalvm

My article in which I explain how to create the Java application that leverages the JavaScript NPM Validator Module: https://technology.amis.nl/2019/10/25/leverage-npm-javascript-module-from-java-application-using-graalvm/

GraalVM Docs on Native Image generation: https://www.graalvm.org/docs/reference-manual/native-image/

Intro to GraalVM on Ben’s Corner: https://fedidat.com/510-intro-to-graal/ 

Docs on GraalJS and Interoperability with Java – https://github.com/graalvm/graaljs/blob/master/docs/user/NodeJSVSJavaScriptContext.md

JavaDocs for GraalVM Polyglot – https://www.graalvm.org/truffle/javadoc/org/graalvm/polyglot/package-summary.html

GraalVM Docs – Polyglot – https://www.graalvm.org/docs/reference-manual/polyglot/

The post Create a Native Image Binary Executable for a Polyglot Java Application using GraalVM appeared first on AMIS Oracle and Java Blog.
Python application running on GraalVM and Polyglotting with JavaScript, R, Ruby and Java

$
0
0

GraalVM is among other things a polyglot language runtime. It can run applications written in many languages – JVM languages like Java, Scala, Groovy and Kotlin as well as non-JVM language such as Python, R, Ruby, JavaScript and LLVM. GraalVM also allows applications in any of these languages to execute code snippets written in any of the other languages it supports. It is like the cab driver that can speak many languages and also is perfectly capable of understanding you when you start interjecting fragments of different languages into your attempt to explain where you want to go.

In this article, I will take a brief look at the polyglot interaction on GraalVM from Python with other languages, specifically Java, JavaScript and R (only scratching the surface). The Python implementation on GraalVM is brand new at this stage (October 2019) and has limited supported for many language features. It is not yet suitable for production usage. As stated on the GraalVM site:

GraalVM’s implementation of Python is in the early stages of development. A primary goal is to support SciPy and its constituent libraries, but we have a long way to go there. At this point, the Python implementation is made available for experimentation and curious end-users. GraalVM currently aims to be compatible with Python 3.7, but it is a long way from there, and it is very likely that any Python program that requires any imports at all will hit something unsupported.

The funny thing is that when you call out to Java, JavaScript and R, the code is interpreted by more mature engines: Java and JavaScript production applications are running on GraalVM today.

image

A great visualization of what running Python on GraalVM means in terms of underlying components is shown below – I have ‘borrowed’ this illustration from the article Introduction to the Python implementation for GraalVM by Franzi Geiger on Medium (August 2019) Python code is parsed into a Truffle Abstract Syntax Tree represented in Java Byte Code. Any non-JVM language running GraalVM is parsed into such an AST. GraalVM’s runtime knows how to run these trees. And the polyglot glue in GraalVM knows how to merge trees before executing them.

image

The sample Python application demonstrates a number of aspects of polyglot interaction from Python:

  • how to evaluate code snippets in various languages (Java, R, JavaScript,Ruby)
  • how to execute a function object returned from another language
  • how to put objects – data objects and functions – into the Polyglot map that lives between all polyglot languages executed on GraalVM
  • how to retrieve objects from the Polyglot map – read and write them or execute them

R, Ruby and JavaScript from Python

image

In each case, a snippet of code is evaluated at runtime and the result of the evaluation against the proper language engine is returned to the Python program, ready for inspection and further manipulation.

Java from Python

image


Java interoperability works a little differently from the polyglot interaction with non-JVM (or Truffle) languages. Java Classes – custom and 3rd party libraries – are provided on the classpath parameter passed to graalpython. All standard Java 8 APIs are available at all times. image

JavaScript from Python – leveraging the Polyglot Map

In this snippet, a variable title is put in the Polyglot map with the export_value function under the key “title”. Next, a JavaScript snippet is evaluated. This results in the creation of an anonymous function that subsequently is returned to Python. In Python, the function is printed and executed. The result is stored in variable msg and finally the value of that function is printed. image

image

The output of running this snippet is shown here. The second line is produced from within the JavaScript function. It shows that the JavaScript code successfully imported the title from the Polyglot Map.

image

JavaScript and R from Python – transferring functions across language barriers

The next snippet is even more convoluted: a JavaScript snippet is evaluated. It exports a function definition into the Polyglot Map under the key squared. The function is imported from the Map in Python – and executed from Python. Subsequently, a snippet of R code is evaluated; this snippet too creates a function that it evaluates to. In this snippet, the R code imports function squared from the Polyglot Map (put there by the JavaScript snippet) and executes it. It also imports title from the map and prints it to the output. The function returned from the R snippet is executed in Python (and indirectly performs what was defined in JavaScript).

image

image

The output from this specific Python code fragment

image

Here is the code for the complete application:

import polyglot
import java

array = polyglot.eval(language="js", string="[1,2,42,4]")
print("JavaScript ",array[2])

array = polyglot.eval(language="R", string="c(1L,2L,42L,4L)")
print("R ",array[1])

array = java.type("int[]")(4)
array[2] = 42
print("Java", array[2])

array = polyglot.eval(language="ruby", string="[1,2,42,4]")
print("Ruby", array[2])

title = "Polyglot Programming"
polyglot.export_value (title, "title" )

func = polyglot.eval(language="js"
       , string="(function(name) { print(`Title from polyglot ${Polyglot.import('title')}`);return `Hello ${name}, welcome to the world of JavaScript`; })")
print(func)
msg = func("Hank")
print("The result of invoking the function produced by the JavaScript function: ",msg)

polyglot.eval(language="js", string="Polyglot.export('key','value');")
value = polyglot.import_value ("key" )
print("Imported key from polyglot",value)

title = "Polyglot Programming"
polyglot.export_value (title, "title" )

# have JS create a function and store it in Polyglot
polyglot.eval(language="js", string="Polyglot.export('squared', x =&amp;amp;amp;gt; {print(x); return x * x})")
js_squared = polyglot.import_value('squared')
result = js_squared(22)
print("The result of invoking function squared imported from polyglot",result)

# have R create a function, leveraing the function squared stored from JS in polyglot
fnc = polyglot.eval(string="""function(input) {
    squared &amp;amp;amp;lt;- import('squared')
    result &amp;amp;amp;lt;- squared(input)
    print( paste('Imported title from Polyglot: ', import('title')))
    result
}""", language="R")

# invoke the function returned from R, leveraging JS
print("squared from R using function from JS",fnc(5))

To run the entire application on GraalVM:

graalpython --polyglot --jvm ./python_polyglot.py

GraalPython is the Python runtime execution engine on GraalVM. The polyglot setting indicates that polyglot language interoperability is active and the jvm switch is currently required for using the JVM as execution platform: To interoperate with other languages, we had to supply the –jvm argument above. This instructs the launcher to run on the JVM instead of in the Native Image mode – you will notice a longer startup time than with the native image graalpython execution engine (substantially longer).

If we want to invoke Java Objects defined outside the Java 8 APIs, we have to provide them to Graalpython by specifying the –vm.cp=<colon separated list of JAR Files, directories> command line option.

The output of running the application:

image

Resources

GitHub Repository with sources for this article: https://github.com/AMIS-Services/jfall2019-graalvm

GraalVM Docs on Graal Python – https://www.graalvm.org/docs/reference-manual/languages/python/

GraalVM Docs – interoperability from Python – https://www.graalvm.org/docs/reference-manual/languages/python/#interoperability

GraalVM Docs – Polyglot including Python as target and as starting language: https://www.graalvm.org/docs/reference-manual/polyglot/

GitHub Home of GraalPython – https://github.com/graalvm/graalpython

Introduction to the Python implementation for GraalVM – https://medium.com/graalvm/how-to-contribute-to-graalpython-7fd304fe8bb9

JavaDocs for GraalVM Polyglot – https://www.graalvm.org/truffle/javadoc/org/graalvm/polyglot/package-summary.html

The post Python application running on GraalVM and Polyglotting with JavaScript, R, Ruby and Java appeared first on AMIS Oracle and Java Blog.

Node JS application running on GraalVM – interoperating with Java, Python, R and more

$
0
0

When you install GraalVM, one of the things you get is a Node runtime environment (GraalVM 19.2.1 is based on Node 10.16.3 – with support for the core Node libraries and un understanding of NPM modules – and has a JavaScript engine that is ECAMScript 2019 compliant). Instead of V8, the usual JavaScript execution engine, this GraalVM environment leverages GraalJS and the JVM as execution platform. GraalJS runs Java Byte code on JVM. This GraalJS engine is a Java application that works on any Java 8+ implementation. Compared to V8, it can run faster and is better scalable to big memory structures. However: it may need some warmup time to reach peak performance: run time optimizations that can make Java applications run faster after some time now also apply to JavaScript execution.

GraalVM is among other things a polyglot language runtime. That means for JavaScript applications running on GraalVM that they can embed and call out to code written in JVM languages like Java, Scala, Groovy and Kotlin as well as non-JVM languages such as Python, R, Ruby and LLVM.

In this article, I will take a brief look at running Node applications on GraalVM and specifically their polyglot interaction on GraalVM with other languages, specifically Java, Python and R (only scratching the surface).

Polyglot Node Application calling out to Java

The sample application under scrutiny is a Node application that makes use of a Java Class provided in a JAR file. The Java Class – Joker – returns jokes from a getJoke() method or as String[] from a getJokes() method.

image

The Java Class can be tried out:

java -cp application-bundle.jar nl.amis.js2java.Joker

The Node application is implemented in Joker2.js. It is very straightforward. The Java Class is loaded with the Java.type call. Subsequently, a single Joker object is instantiated with the new statement. In function getJoke(), a call is made to the getJoke() method on javaJoker1 – the Java method that returns a random element from the jokes collection.

image

The application can be run with this command line:

node –jvm –vm.cp application-bundle.jar  joker2.js

image

This is visualized as follows:

image

The JVM with GraalVM is the runtime environment where the Java Byte code is executed and optimized. The JavaScript code is interpreted by GraalJS and turned into an AST (abstract syntax tree) representation in Java Byte code. Because the JVM is the runtime engine, and the –jvm switch is passed, all Java 8 APIs are available at runtime and can be engaged from the JavaScript code. With the –vm.cp switch, the classpath is defined to indicate where at runtime additional (custom and 3rd party) Java Classes should be looked for. In this case, JAR file application-bundle.jar is passed in. Finally the Node application’s entry file is provided as well (joker2.js).

The program flow at runtime can be visualized as follows:

image

Polyglot Node Application embedding Python, Ruby and R

A Node application running on GraalVM can evaluate embedded, inline code snippets and also load sources from file. These code snippets and source can be defined in all languages that through Truffle parsing can run on GraalVM; these include Ruby, R, Python and LLVM languages (such as C, C++, Fortran, Rest and Swift). The node application should be run with the –polyglot command line switch, to engage the polyglot interoperability features.

The next file is a JavaScript application that can be run with the node or the js runtime. It does not use anything Node specific. The application – polyglot.js – evaluates code snippets in three languages, using the Polyglot object’s eval function. It also loads and evaluates a separate Python library library.py.

The most interesting parts to me are the definition of function Fibonacci: the function is defined in the library.py (def Fibonacci…) – loaded in line 11 – but it takes the evaluation and assignment to fibFunc – line 12 -to make the function executable from JavaScript. It is executed in line 13. That is JavaScript calling a recursive function written in Python and loaded from an external file. In line 16, another Python function object is created using a lambda expression. In line 18, this function is executed. In line 20 – a function is defined in R. In line 23, JavaScript invokes a function that is actually an R based function. Pretty cool if you ask me.

imageThe file is executed with this command

js –polyglot –jvm polyglot.js

The output:

image


Polyglot Node Application calling out to Java that calls out to JavaScript

In this earlier article I discussed how a Java application running on GraalVM can leverage JavaScript and even NPM JavaScript modules. I was then wondering: can I call a Java Object from JavaScript when that Java Object itself calls out to JavaScript? Does that take anything special? The answer: yes, I can. And no, it does not take anything special at all.

The Java Class that calls out to JavaScript is ValidateThroughNPMValidator.java:

image

The class is bundled in the same application-bundle.jar file we saw before, including the validator-bundled.js file that it loads at runtime.

The salient part of the Node application that leverages the Postal Code capabilities of the Java Class is shown below:image

Of course here we do not see that real validation goodness is not actually coming from Java but from JavaScript. The GraalVM engine turns both Java and JavaScript to a byte code that is just executed, regardless of their origin.

image


Resources

GitHub Repository with sources for this article: https://github.com/AMIS-Services/jfall2019-graalvm

GraalVM Docs on Node / JavaScript https://www.graalvm.org/docs/reference-manual/languages/js/

GraalVM Docs – interoperability from JavaScript – https://www.graalvm.org/docs/reference-manual/languages/js/#interoperability

GraalVM Docs – Polyglot including JavaScript / Node as target and as starting language: https://www.graalvm.org/docs/reference-manual/polyglot/

GitHub Home of GraalJS – https://github.com/graalvm/graaljs

JavaDocs for GraalVM Polyglot – https://www.graalvm.org/truffle/javadoc/org/graalvm/polyglot/package-summary.html

The post Node JS application running on GraalVM – interoperating with Java, Python, R and more appeared first on AMIS Oracle and Java Blog.
The state of Java [developers] – reflections on Devoxx 2019

$
0
0

I attended Devoxx Belgium – November 2019. The yearly gathering of over 3000 Java developers (numbers provided by Devoxx website). Maybe not all of them Java and perhaps some not even developers. But by and large … Java and software development are the core themes.

image

This conference has taken the place of JavaOne as the premier venue for the Java community – to exchange ideas, make announcement, promote open source projects and win the hearts and minds of the community at large. It is a great place to learn , get comforted by the pains that others go through such as much as you are yourself, get answers to burning questions and most of all: be inspired. I leave Devoxx with a head full of plans, ideas, intentions, question and ambitions. It will sustain me for a long time. And if I need more – I will check the online videos at YouTube where almost all talks are available.

In this article – I have tried to “persist” some of the ideas and findings that are spinning around in my head. I am aware – and so should you be, my dear reader – that there is a bit of bias involved. The conference offered curated content: decisions were made by the organizers about what subjects to include in the agenda – and which ones not. Perhaps topics that are very relevant were excluded in that way. I also did not visit all sessions: I chose sessions that fit in with my highly personal frame of mind (even though I try to attend some sessions way out of my comfort zone).

Some of my conclusions are not well founded on objective fact and measurements; they reflect my sense of the buzz and general sentiment at this conference – highly influenced by my own preferences and the people I talked with (and not those I did not talk to). With all these caveats, I believe I did capture something that is relevant – at least to me going forward. At the same time I would like to invite you to add comments to this article, to give me a piece of your mind. What did you learn and conclude? Do you concur with what I deduced or do you have an alternative opinion to share?

Shakers and Movers, Hot and Lukewarm and Cool (or not so cool)

Some technologies, tools, frameworks, standards, themes are hot, others are distinctly not. Devoxx is a great place to get feel for what is happening and what is running out of steam. There are several ways of classifying. In the end, I give this ‘gut feel’ based classification.

  • Foundational (everyone is using this, no discussion needed) : Maven, Java (8), REST (& JSON), containerized, Kubernetes, JUnit, IntelliJ IDEA, Jenkins
  • Strong contenders (close to widespread or even general adoption, could be a relatively new very promising kid on the block ): GraalVM, Kotlin, Quarkus, Micronaut, Visual Studio Code, PostgreSQL, Reactive style, Netty, Microprofile, Go, DevOps, production environment testing (canary, A/B), microservices
  • To watch: RESTEasy, Knative, Apache Pulsar, Rust
  • Under pressure (apparently losing ground ): Eclipse, Spring, Grails, Scala, Groovy, Reflection & Dynamic Class Loading, Java EE/Jakarta, JBoss/WildFly | WebLogic | WebSphere
  • Fading into background: Swing

image

Themes & Messages

Java runtime – lean and fast

Prepared for Serverless Functions and Containerized Microservices (dynamic, horizontal scalability on container platforms)

There is a very clear trend of being smarter about building applications to enable being better with running them. By removing stuff at compile time that will not be used at runtime anyways, we can create smaller uberjars and get away with trimmed down Java runtime environments. By inspecting code at pre-compile time – much of the work that is typically done at run time (with reflection and dynamic class loading) can be handled by source code manipulatio. This includes weaving in aspect code, manipulating code based on annotations.

Some concrete aspects to this theme: 

  • Smart container image building for Java applications (Jib – for quick because smart image rebuild)
  • Smart compile time optimizations (Quarkus, Micronaut – for expanding annotations, chucking out unneeded classes, injecting code)
  • Native Image (GraalVM, Quarkus, Micronau – create native image/platform specific binary executable with small size, small memory footprint and quick startup)

Do not do expensive runtime stuff such as reflection, dynamic proxies, AOP and dynamic class loading

DevOps – the Developeratorimage

The distinction between development and operations is rapidly becoming meaningless. A separate operations department may be concerned with the platform (Kubernetes and all underlying IaaS). However, application operations are done by the same team that has created and rolled out the software. Testing is increasingly done in Production (with canary workloads), monitoring is being upgraded to provide immediate insight to the Developerators, mean time to repair is reduced through automated build, regression test and (controlled) release. There is no handover to ‘another department’ or even ‘the Ops-people on the team’.

This not a bane for developers. It is actually a boon. To have a rapid feedback cycle from creating code to having that code being used and seeing the metrics of that usage is exhilarating. Being informed of an issue and being able to analyze the issue, develop a fix and release solution all in a matter of hours is equally fulfilling. Okay, having to do that at night is not great. So perhaps do no release major changes just before you go home for the day. Or ever: try to break up changes into smaller changes – perhaps using feature toggles or flags to release code that is not necessarily active.

Clean Code

80-90% of IT budget is spent on maintaining and evolving systems, not on building them from scratch. Code is read 10 times more often than it is written. Even the original author of the code will not have any recollection of the how and why of her own code after a weeks’ spent on other topics. Productivity, quality and joy in the lives of developers is increased with clean code – that is easily read and understood. Code whose meaning is clear. What it does and why it does that.

  • Naming of variables, methods and classes: clear naming is mandatory.
  • Methods should be short (one page in the IDE – 20 lines of code or preferably less)
  • Methods should not have more than three parameters
  • Parameters should not be of type Boolean – at least not used as flags to request alternative behaviors of the method
  • Methods that return a result should not have side effects; methods that return null can have a side effect; make clear in the name of the method what that side effect is
  • Comments in code should rarely be used – the code should speak for itself. However, comments that reveal workaround for non trivial issues and bugs are valuable. Or that explain a special corner case.
  • (serious) Peer reviews should ensure that code does speak for itself.

You should only commit code that you are prepared to add to your CV.

Watch: this talk by @VictorRentea on Clean Code: http://youtube.com/watch?v=wY_CUkU1zfw…


Developer – know your IDE! For productivity, refactoring, uniform code [quality], instant testing

Get the most out of your IDE. For productivity and fun. For overcoming fears of refactoring – and to apply refactoring. One of the most important refactoring tools: Extract Method.

image

For a still increasing number of people, that IDE is IntelliJ. At the same time, there is a meteoric rise in the use of Visual Studio Code. Eclipse is losing ground rapidly. Who even remembers NetBeans or Oracle JDeveloper?


Letting go, Learning and Unlearning, Deprecate

The challenge to get rid of stuff – old ways of doing things, old technologies with unnecessary shortcomings, old fears and long held beliefs – is tremendous. On various levels – from psychological to economic. We have to be prepared to unlearn things – even or maybe especially things we have done and known and believed in for many years. At least be prepared to change and embrace new ways of doing things if they are better. With our experience, we should be able to judge whether they are better – if we can be really honest.

Being able to get rid of technologies that are really of yesteryear is a challenge: there are risks involved, there is no immediate business benefit [so how to find budget, time and priority]. However, continuing on with those technologies is risky and in de long run similarly challenging [ unsupported, vulnerable technology for which no developers and admins can be found, that are unproductive and eventually may not run on the platform, the OS or the hardware].

The Java Platform – OpenJDK, distributions, HotSpot and GraalVM

OpenJDK is an open source project – with sources for the open source implementation of the Java Platform Standard Edition. OpenJDK does not ship binaries. Various companies provide builds or binary distributions based on OpenJDK – a bit like various companies provide their own distributions of the Linux (open source) Kernel. Oracle happens to be one of them – but not necessarily still the leading one. Other builds are available from AWS (Corretto), Azul (Zulu), RedHat, SAP and IBM. Rumours are spreading that Microsoft will soon ship its own build as well. Note: as one source told me, up to 75% or more of the commits on the OpenJDK projects are made by Oracle staff. Some of the negative emotions projected at Oracle may be softened a little if people would be aware of that fact. Oracle is still the by far biggest contributor to the evolution of the Java platform.

The HotSpot Virtual Machine is part of OpenJDK. As such, both the C1 and C2 JIT compilers are there. These compilers have been implemented in C/C++. It has become quite hard to further evolve especially the C2 compiler – although that certainly is going on with for example Java language enhancements such as Valhalla, Panama and Loom. All (?) JVM distributions ship the HotSpot compilers.

Oracle Labs produced GraalVM. Under this umbrella project, several components are worked on. One is a new JIT compiler that can replace the current C2 HotSpot compiler. This compiler is created to better optimize modern Java Byte code patterns that are getting more common for example with Java Byte code originating from Scala code or from modern Java features such as Streams. The GraalVM JIT Compiler can be enabled in existing JVM environments to implement the JIT compiler and as such bring modern optimization patterns (this I believe is the approach taken by Twitter to run their Scala applications).

Also read this quite good Baeldung article.

Note: it seemed at Devoxx that 80% of attendees was on Java 8 and 20% was on later versions already.

The Star of the Show: GraalVM

imageIf I would have to decide what the biggest star of this week of Devoxx was, I would say the prize goes to GraalVM. GraalVM started life as a research project in Oracle Labs – to see if a replacement could be created for C2 – the C++ based HotSpot JIT compiler that had gotten very hard to maintain and optimize for modern code paths. In seven years, GraalVM has expanded quite a bit. It has delivered the JIT compiler that we can now all plug into our JDK environments to improve [in certain cases substantially] the performance of our Java applications. Additionally, GraalVM can run applications written in other – non JVM – languages such as JavaScript/Node, R, Ruby, Python and LLVM languages (C/C++, Rust, Swift, ..) and it can run hybrid or polyglot applications that combine multiple languages.

A feature of GraalVM that played an important role during Devoxx this year is its ability to produce a native image (a stand alone binary executable) for a Java application through Ahead of Time compilation. After normal compilation, GraalVM produces a single binary file that contains everything needed to run the Java application. This binary file starts a small as 10 MB – and it does not need anything else to run. No JRE or any form of Java Run Time. It just runs as native applications – because that is what it is. Startup time is every short and memory footprint is very small – ideal characteristics for Serverless Functions and dynamically scalable containerized applications. Because AOT is applied instead of JIT, there will be no run time optimizations to the application – which for serverless use cases is typically not a big loss at all. Quarkus and Micronaut are frameworks that make great use of GraalVM to produce even faster startup and smaller runtime footprint.

image

Oracle offers GraalVM in two flavors: a community edition which is based on open source and is offered for free and the enterprise edition which is paid for and offers 24/7 support and enhanced optimizations in the native image as well as improved security. For Oracle Cloud users, GraalVM Enterprise Edition is included in their subscription. Here is the global price list for GraalVM Enterprise Edition – a short inspection suggests a price of $12K to $19K per processor.

The big question around GraalVM is: will Oracle make the Community Edition sufficiently more appealing than OpenJDK with HotSpot to build up real traction and will it not bring too many goodies to the Enterprise Edition? To be fair: GraalVM offers many attractive features and it seems quite reasonable that Oracle stands to make some money for that effort and the value it delivers. Another question: will Oracle be able to follow the evolution of the Java language in GraalVM – such as the language enhancements discussed in the next section. It took until 19th November of 2019 before GraalVM provides full Java 11 support.

Note: GraalVM has been promoted from a research project to a ‘real product’ and the team around GraalVM is growing rapidly. This includes product management in addition to probably more developers and support engineers. GraalVM is serious business for Oracle.

Java Evolution

Java execution is still quite special: the runtime optimization performed by the JVM (C2 JIT compiler) provides many times better performance than static compilers.

Compatibility – old code must still run. Still the platform managed to absorb Generics, Lambdas and Streams, a Modular system. What are driving forces? Changing hardware, changing challenges and changing software [ how other languages do things].

  • Project Amber – productivity oriented language features ( Local Variable Type Inference (JDK 10), Switch Expressions (JDK 12), Text Blocks (JDK 13), Concise class declarations (records), Sealed types, Pattern Matching)
  • Java Fibers  and Continuations – Project Loom – concurrency, light weight focused at scalability: “A light weight or user mode thread, scheduled by the Java virtual machine, not the operating system. Fibers are intended to have very low footprint and have negligible task-switching overhead. You can have millions of them! Fibers allow developers to write simple synchronous/blocking code that is easy read, maintain, debug and profile, yet scales. Project mantra: Make concurrency simple again” Fibers are built on top of continuations – a low level construct in the HotSpot VM.image
    (it is to be decided whether continuations themselves in their own right are to be exposed to developers). Associated terms: yield, async, (carrier) thread, executor, Promise, await, park and unpark. Watch: https://www.youtube.com/watch?v=lIq-x_iI-kc 
  • Project Valhalla – “reboot the layout of data in memory” –  value types and specialized generics – benefitting from modern hardware – not everything needs to be an object – getting more instructions per CPU cycle by removing the memory [pipeline] bottleneck (first release deep into 2020)
  • Project Panama – allow easy access to Java developers to native libraries – go beyond JNI (improve on the complexity, lack of JIT optimization, exchanging of native structs and off-heap data structures) and make a native library accessible in Java through JDK generated Interface. This hides away most of the native aspects of what is still a native library (see: https://www.youtube.com/watch?v=cfxBrYud9KM and read Project Panama home page https://openjdk.java.net/projects/panama/) Note: some overlap with GraalVM interoperability. Early access builds are available for Panama.

Books

Three special  book tips:

And a website:

Tools

Below is a fairly random list of tools, sites, services and technologies that came to my attention during this Devoxx 2019 conference. They seem interesting, I would like to try them out. Most of them are as yet unknown. If you can recommend any – do let me know!

  • DeckDeck Go – https://deckdeckgo.com/ Presentation Editor

  • Karate (DSL) https://github.com/intuit/karate – open-source tool to combine API test-automation, mocks and performance-testing into a single, unified framework

  • K3S Light weight Kubernetes https://k3s.io on Ubuntu; Similar: https://microk8s.io/

  • Kind – Kubernetes in Docker- https://github.com/kubernetes-sigs/kind

  • nip.io Dead simple wildcard DNS for any IP Address; allows you to do that by mapping any IP Address to a hostname

  • lvh.me

  • Dive – inspecting and comparing Container Image (layers) – https://github.com/wagoodman/dive

  • Newman – programmatic execution of Postman Test Collections

  • WireMock is a simulator for HTTP-based APIs (http://wiremock.org/)

  • http://rest-assured.io/ – testing REST APIs from java

  • GitBook

  • JDeferred – https://github.com/jdeferred/jdeferred – Java Deferred/Promise library similar to JQuery.

  • Dive – inspecting container image layers – https://github.com/wagoodman/dive

  • Kind – https://github.com/kubernetes-sigs/kind Kubernetes in Docker

  • Testcontainers – Java gebaseerd programmatisch starten en manipuleren van containers op local or remote docker host

  • QuickPerf – extension of JUnit – voor testen van performance gerelateerde applicatie-aspecten (in een heel vroeg stadium)

  • Jbi – smart container image generation voor Java applicaties; ook : Skaffold (Container Pipeline), Helm (deployment van K8S applicaties) en Kustomization (omgevingspecifieke overrides van K8S yaml files)

  • Google Cloud Run – very simple ‘run my container’ service

  • Buildpacks – Buildpacks build apps in a consistent, repeatable way. Buildpacks know what a specific application type needs in terms of its runtime. The big idea behind buildpacks? Building containers from source code should be completely automated.

  • Microbenchmarking the JVM:  https://openjdk.java.net/projects/code-tools/jmh/  (see https://www.youtube.com/watch?v=5AFgNuGwLos for a session that includes a demo)

  • Jest – JavaScript testing – https://jestjs.io/ 

  • Chai is a BDD / TDD assertion library for node and the browser that can be delightfully paired with any javascript testing framework. – https://www.chaijs.com/

  • Apache Beam – data pipeline coordination

  • ArrangoDB – multi model database

  • Fairing

  • Storybook – https://storybook.js.org/ – Storybook is an open source tool for developing UI components in isolation for React, Vue, and Angular. It makes building stunning UIs organized and efficient.

  • Portecle – is a user friendly GUI application for creating, managing and examining keystores, keys, certificates, certificate requests, certificate revocation lists and more – http://portecle.sourceforge.net/ (that is HTTP not HTTPS)

  • OpenSSL – OpenSSL is a robust, commercial-grade, and full-featured toolkit for the Transport Layer Security (TLS) and Secure Sockets Layer (SSL) protocols. It is also a general-purpose cryptography library. – https://www.openssl.org/

  • NMap – https://nmap.org/ Nmap (“Network Mapper”) is a free and open source (license) utility for network discovery and security auditing. It was even featured in twelve movies, including The Matrix Reloaded, Die Hard 4, Girl With the Dragon Tattoo, and The Bourne Ultimatum.

  • GopherJS – browser playground for Go(Lang) – and: transpile Go application to JavaScript – https://github.com/gopherjs/gopherjs 

  • Anthos – Google’s K8S based Cloud Native platform (istio, ..)

  • Kubernetes Security:

    • Kube-bench – Checks whether Kubernetes is deployed according to security best practices as defined in the CIS Kubernetes Benchmark – https://github.com/aquasecurity/kube-bench

    • Clair – Clair is an open source project for the static analysis of vulnerabilities in appc and docker containers. – https://coreos.com/clair

    • Falco (CNCF, find rogue workloads, checks all sys calls – including SSH calls and disk writes), Falco is an open source project for intrusion and abnormality detection for Cloud Native platforms such as Kubernetes, Mesosphere, and Cloud Foundry. Detect abnormal application behavior. – https://falco.org/ 

    • Sonobuoy a diagnostic tool that makes it easier to understand the state of a Kubernetes cluster by running a set of Kubernetes conformance tests and other plugins in an accessible and non-destructive manner.- https://github.com/vmware-tanzu/sonobuoy 

    • Harbor (is an open source container image registry that secures images with role-based access control, scans images for vulnerabilities, and signs images as trusted.),

    • kube-hunter an open-source tool that hunts for security issues in your Kubernetes clusters. It’s designed to increase awareness and visibility of the security controls in Kubernetes environments.- https://kube-hunter.aquasec.com/

    • open policy agent – www.openpolicyagent.org

  • https://github.com/codesenberg/bombardier Bombardier – http benchmarking

  • https://nivo.rocks/ – visualization with React and D3.js

  • Kiali – Service mesh observability and configuration – https://www.kiali.io/ 

These come on top of the more usual suspects such as Helm, Prometheus, Jaeger, Grafana, Maven, JUnit. Java Lambdas and Streams should be every day tools for Java Developers by now.

The post The state of Java [developers] – reflections on Devoxx 2019 appeared first on AMIS Oracle and Java Blog.
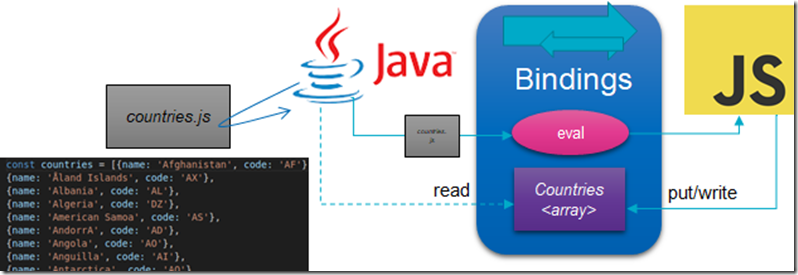
Java Microservices: What do you need to tweak to optimize throughput and response times?

$
0
0

Performance tuning usually goes something like followed:

  • a performance problem occurs
  • an experienced person knows what is probably the cause and suggests a specific change
  • baseline performance is determined, the change is applied, and performance is measured again
  • if the performance has improved compared to the baseline, keep the change, else revert the change
  • if the performance is now considered sufficient, you’re done. If not, return to the experienced person to ask what to change next and repeat the above steps

This entire process can be expensive. Especially in complex environments where the suggestion of an experienced person is usually a (hopefully well informed) guess. This probably will require quite some iterations for the performance to be sufficient. If you can make these guesses more accurate by augmenting this informed judgement, you can potentially tune more efficiently.

In this blog post I’ll try to do just that. Of course a major disclaimer applies here since every application, environment, hardware, etc is different. The definition of performance and how to measure it is also something which you can have different opinions on. In short what I’ve done is look at many different variables and measuring response times and throughput of minimal implementations of microservices for every combination of those variables. I fed all that data to a machine learning model and asked the model which variables it used to do predictions of performance with. I also presented on this topic at UKOUG Techfest 2019 in Brighton, UK. You can view the presentation here.

Method

Variables

I varied several things

  • wrote similar minimal hello world like implementations in 10 frameworks (see code here)
  • varied the number assigned cores
  • varied the memory available to the JVM
  • varied the Java version (8,11,12,13)
  • varied the JVM flavor (OpenJ9, Zing, OpenJDK, OracleJDK)
  • varied the garbage collection algorithm (tried all possible algorithms for every JVM / version)
  • varied the number of concurrent requests

What did I do?

I measured response times and throughput for every possible combination of variables. You can look at the data here.

Next I put all data into a Random Forest Regression model, confirmed it was accurate and asked the model to provide me with feature importances. Which feature was most important in the generated model for determining the response time and throughput. These are then the features to start tweaking first. The features with low feature importance are less relevant. Of course as I already mentioned, the model has been generated based on the data I’ve provided. I had to make some choices, because even when using tests of 20s each, testing every combination took over a week. How accurate will the model be when looking at situations outside my test scenario? I cannot tell; you have to check for yourself.

Why did I use Random Forest Regression?

  • It was easy to use and suitable for my data. A (supervised learning) regression model with a right balance between bias and variance.
  • It allowed easy determination of feature importance
  • I also tried Support Vector Regression but was unable to obtain accuracy even close to Random Forest Regression. This was for me a sign of underfitting of SVR; the model was unable to capture the patterns in the data

Which tools did I use?

Of course I could write a book about this study. The details of the method used, explain all the different microservice frameworks tested, elaborate on the test-tooling used, etc. I won’t. You can check the scripts yourself here and I already wrote an article about most of the data here (in Dutch though). Some highlights;

  • I used Apache Bench for load generation. Apache Bench might not be highly regarded by some but it did the job well enough; at least better than my custom code written first in Node and later rewritten in Python. When for example comparing performance of load generation to wrk, there is not much difference, only at higher concurrency, which was outside of the scope of what I had measured (see here). For future tests I’ll try out wrk.
  • I used Python for running the different scenario’s. Easier than Bash, which I used before.
  • For analyzing and visualization of the data I used Jupyter Notebook.
  • I first did some warm-up / priming before starting the actual tests
  • I took special care not to use virtualization tools such as VirtualBox or Docker
  • I also looked specifically at avoiding competition for resources even though I measured on the same hardware as where I produced load. Splitting the load generation and service to different machines would not have worked since the performance differences, were sometimes pretty small (sub millisecond). These differences would be lost when transporting over a network.

Results

Confirm the model is accurate

In the below plot I’ve shown predicted values against actual values. The diagonal line indicates perfect accuracy. As you can see accuracy is pretty high of the model. Also the R^2 value (coefficient of determination) was around 0.99 for both response times and throughput which is very nice!

Feature importance

The below graphs show the results for feature importance of the different variables.

However I noticed feature importance becomes less accurate when the number of different classes differs per variable. In order to fix that I also looked at permutation feature importance. Permutation feature importance is determined by calculating the reduction in model accuracy when a specific variable is randomized. Luckily this looked very similar:

Finally

Most important features

As you can see, the feature importance of the used framework/implementation was highest. This indicates the choice of implementation (of course within the scope of my tests) was more important than for example the JVM supplier (Zing, OpenJ9, OpenJDK, OracleJDK) for the response times and throughput. The JVM supplier was more important than the choice for a specific garbage collection algorithm (the garbage collection algorithm did not appear to be that important at all, even though when memory became limiting, it did appear to become more important). The Java version did not show much differences.

Least important features

The least important features during these test were the number of assigned cores. Apparently assigning more cores did not improve performance much. Because I found this peculiar, I did some additional analyses on the data and it appeared certain frameworks are better in using more cores or dealing with higher concurrency then others (when not specifically tuning the individual frameworks/HTTP servers thus using default settings).

You can check the notebook here.

A nice method in theory

This method to determine the most important features for response times and throughput is of course difficult to apply to real-life scenario’s. It will be difficult to try all different combinations of variables since in more complex environments (for example virtualized), there can be many things which can be varied and performing an accurate reproducible performance test might take a long time.

The method suggests the actual implementation (framework) was the most important feature for response times and throughput. How useful is a result like this? Can the model generalize outside the scope of the code/environment/tested variables? Usually you cannot easily switch the framework for production applications. Even though they are important in performance, the JVM flavor is mostly provided by a team focusing on infrastructure and ‘a given’ for developers. The choice can be related to support contracts for example.

So where is the value?

You can use the results as an inspiration for knobs you can turn to get better performance. Also, when you have a lot of performance data gathered already, feeding them into a suitable model might provide you with valuable insights you might have missed otherwise.

The post Java Microservices: What do you need to tweak to optimize throughput and response times? appeared first on AMIS Oracle and Java Blog.


Apache Camel + Spring Boot: Different components to expose HTTP endpoints

$
0
0

Apache Camel is an open source integration framework that allows you to integrate technologically diverse systems using a large library of components. A common use-case is to service HTTP based endpoints. Those of course come in several flavors and there is quite a choice in components to use.

In this blog post I’ll take a look at what is available and how they differ with respect to flexibility to define multiple hosts, ports and URLs to host from using a single CamelContext / Spring Boot application. Depending on your use-case you will probably be using one of these. You can find my sample project here.

Components

REST DSL

The REST DSL is not an actual component but can be considered a wrapper for several components. It has integration with for example the Swagger module to generate documentation. It uses a RestConfiguration which can only occur once in a CamelContext (when using Spring Boot in combination with Apache Camel). The RestConfiguration specifies things like the base URL, the port and the component used as consumer / HTTP server.

Although easy to use, it is also limiting in that only a single RestConfiguration can be used within a CamelContext and that using multiple CamelContexts within a single application is not supported (see here). Thus this will not allow you to host services on different ports from the same Spring Boot / Apache Camel application. Also it is not allowed to define the same base path for different services in two different component-routes. You can run on a different port then the base Apache Camel / Spring Boot servlet engine though.

restConfiguration().component("netty-http").host("0.0.0.0").port(8084);
rest("/url1").get().id("test_route1").to("log:dummylog");

restConfiguration().component("netty-http").host("0.0.0.0").port(8085);
rest("/url2").get().id("test_route2").to("log:dummylog");

A small example of using the REST DSL above. Mind that both services will be run on port 8085 since there is only one restConfiguration! The REST DSL is powerful since it wraps several other components. If I want to switch to for example jetty instead of netty-http, I only have to change the component specification in the REST configuration and no other code (if I made sure not to use implementation specific features of the different components). You can also externalize the component specification to make switching your HTTP server as simple as changing a property file.

You can find the documentation here and an example on how to use it here.

REST

The REST component is quite powerful. It allows you to easily expose REST endpoints using various other components which implement the org.apache.camel.spi.RestConsumerFactory such as the http, undertow, servlet, netty-http, spark-rest and jetty. Also it has a flexible URI syntax. It integrates tightly with the REST DSL.

If you do not want to use the RestConfiguration class, you can directly configure the component from the CamelContext. The RestComponent however does not have a setPort method. I could not find a quick way to create multiple rest components running on different ports. This is similar as to using REST DSL.

RestComponent sc = getContext().getComponent("rest",RestComponent.class);
sc.setConsumerComponentName("jetty");
from("rest:get:/:url1").id("test_route1").to("log:dummylog");

Mind that you explicitly need to specify the component to use if it is not present in the RestConfiguration and you have multiple components providing the RestConsumerFactory on your classpath. Else you will encounter the following error:

Caused by: java.lang.IllegalArgumentException: Multiple RestConsumerFactory found on classpath. Configure explicit which component to use.

HTTP

The camel-http component (in Apache Camel 2.x use camel-http4 instead) allows you to consume HTTP services. It does not allow you to host services with. For that the jetty component is recommended.

Jetty

You can use the Jetty component to create multiple routes with the same or different ports and specify different URLs for the same port in different routes.

The below example will work.

from("jetty:http://0.0.0.0:8083/url1").id("test_route1").to("log:dummylog");
from("jetty:http://0.0.0.0:8083/url2").id("test_route2").to("log:dummylog");

Jetty has the challenge that Jetty libraries are regular inhabitants of several application servers (at least WebLogic). If you want the classes from your deployment to be used instead of the (often outdated) application server versions, you might need to manipulate dependencies and class loading (create web.xml files, deployment descriptors, etc).

Servlet

The servlet component allows you to host services at different endpoints, however you don’t have the option to configure different ports or URLs outside of the path specified in the property camel.component.servlet.mapping.context-path and server-port in application.properties when using the Apache Camel Servlet Spring Boot starter. You can not easily run on a different port then the base Apache Camel / Spring Boot servlet engine.

//Both OK, however path below camel.component.servlet.mapping.context-path and uses the same port
from("servlet:/url1").id("test_route1").to("log:dummylog");
from("servlet:/url2").id("test_route2").to("log:dummylog");

Netty-http

The Netty-http component facilitates HTTP transport using the Netty component. The Netty component is low-level and socket based while netty-http allows you to easily do HTTP with Netty. Netty-http allows you to use the same port in different routes as long as the NettyServerBootstrapConfiguration is the same. This means the configuration of the route is the same; they use the same parameters in the URI. This creates in my opinion a lot of flexibility.

In the below example you can see that hosting on the same port with different URLs works without challenges.

The relevant code:

from("netty-http:http://0.0.0.0:8083/url1").id("test_route1").to("log:dummylog");
from("netty-http:http://0.0.0.0:8083/url2").id("test_route2").to("log:dummylog");

Undertow

The Undertow component allows you to host HTTP and WebSocket endpoints.

from("undertow:http://0.0.0.0:8083/myapp1").id("test_route1").to("log:dummylog");
from("undertow:http://0.0.0.0:8084/myapp2").id("test_route2").to("log:dummylog");

Using Undertow has the benefit of not conflicting with application server libraries on WebLogic. An example of how to use Undertow and Netty to run an Apache Camel / Spring Boot application on WebLogic can be found here. Wildfly also uses Undertow as HTTP server and you might encounter issues there.

Spark REST

The Spark REST component and Spark Framework have nothing to do with Apache Spark!

Spark Framework is not the same as Apache Spark!

If you want to interface with Apache Spark, you should use the Spark component. The Spark REST component allows you to use  Spark Framework. This is a micro framework for creating web applications in Kotlin and Java 8. Mind that the support for Java 8 in Apache Camel 3.x is best effort; you should be running Apache Camel 3.x on Java 11!

It uses Jetty and provides an alternative syntax to the REST DSL. You can however use the REST DSL instead of Spark but still use the Spark REST component. In that case you can still obtain the raw Spark request by using the getRequest method in org.apache.camel.component.sparkrest.SparkMessage and still do Spark specific things with that.

Supplying the port option in the URI did not work:

Caused by: org.apache.camel.ResolveEndpointFailedException: Failed to resolve endpoint: spark-rest://get:url1?port=8083 due to: There are 1 parameters that couldn't be set on the endpoint. Check the uri if the parameters are spelt correctly and that they are properties of the endpoint. Unknown parameters=[{port=8083}]

I discovered the port is a property of the Component instance and not the Endpoint. The Component instance can be obtained from the CamelContext. However, since there is a single Component instance of spark-rest in the CamelContext, you can only supply a single port. Using the RestConfiguration for this of course does not help either since there is also only one instance of that class available in the CamelContext. A workaround for this is adding more components to the CamelContext with different names and a different configuration.

SparkComponent sc = getContext().getComponent("spark-rest",SparkComponent.class);
sc.setPort(8083);

SparkConfiguration sc2config = sc.getSparkConfiguration();
SparkComponent sc2 = new SparkComponent();
sc2.setSparkConfiguration(sc2config);
sc2.setPort(8084);
getContext().addComponent("spark-rest2",sc2);

from("spark-rest://get:url1").id("test_route1").to("log:dummylog");
from("spark-rest2://get:url2").id("test_route2").to("log:dummylog");

This way you can run on multiple ports/URLs using a distinct Component instance per port. This code is however Spark specific and if you want to switch to for example plain Jetty, you have to change it. Also there is the application server challenge since it uses Jetty.

Finally

Summary

Please mind there are many other considerations for choosing a specific component. You can think of specific features like WebSocket support, performance, security related features, blocking (jetty, spark, servlet) or non-blocking (netty, undertow) nature, resource consumption, etc.

The below table summarizes my findings on components which can be used to run as Apache Camel HTTP server within Spring Boot. Red means no (no no expected issues is a good thing ;), green means yes, yellow means ‘it depends’ or ‘not easily’. Undertow, Jetty, Netty come out quite nicely as being a flexible components in respect to hosting on different ports and URLs. They can be used with the REST DSL, however when you do, you’ll loose this flexibility. I can’t recommend using servlets. They are not flexible and you can expect challenges on application servers. When comparing Spark Framework and the REST DSL for REST specific features, I’d go for the more mainstream REST DSL which can be used by several components including Spark Framework. When not using application servers which use Undertow themselves such as Wildfly, Undertow appears to be a good choice.

Apache Camel 2.x vs Apache Camel 3.x

The differences between Camel 2.x and Camel 3.x are well described in the migration guide. Two things I directly encountered are listed below.

groupId of artifacts

In Apache Camel 2.x most of the Spring Boot related artifacts such as the starters are present under groupId org.apache.camel. For Apache Camel 3.x the documentation specifies org.apache.camel.springboot as the groupId. Here only artifacts for the 3.x version are present.

netty4-http and camel-http4

Apache Camel 2.x has netty-http which is deprecated and netty4-http which is a newer version of the component which should be the one to use. For the camel-http component it is similar. Don’t use it, but use camel-http4. In Apache Camel 3.x however there is is no ‘4’ version of both components and just netty-http and http. Thus for Apache Camel 2.x you should use netty4-http and camel-http4 while for Apache Camel 3.x you should use netty-http and http. This is also something to mind when migrating.

The post Apache Camel + Spring Boot: Different components to expose HTTP endpoints appeared first on AMIS Oracle and Java Blog.
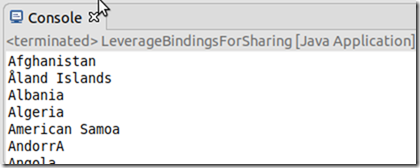
Override Date.now() based on OS time when Node returns incorrect current date

$
0
0

I was facing a weird issue. In my Node application – version 10.6.3 – running on Ubuntu – 18.04 – I got the wrong value for the current date and time. A call to new Date() and to Date.now() resulted in a wrong value, off by over two months:

image

The top two values are the formatted date and value for now:

console.log(new Date())
console.log( Date.now())

The other values are the date reported by the operating system. For some bizarre reason, the value constructed in the Node runtime engine is off by two months, 27 days and over 14 hours.

I do not know why this is. I have not been able to find a cause nor a fix.

To make my programs at least function correctly, I have added a detection of this spread between JavaScript Date and OS Date and an override of the now() function on the Date object to make things right – or at least functioning. I later realized that overriding now() is useful for running tests that have to mock a specific date and time or for running a prank on your colleagues.

A little example of what I did:

image

const { execSync } = require('child_process');

console.log(`Date according to Node: ${new Date()}`)
console.log(`result of Date.now():  ${Date.now()}`)

const da = execSync('date');
console.log(`OS date and time ${da}`)
const d = Date.parse(da)
console.log(`OS timestamp in ms ${d}`)

if (d - Date.now() &gt; 10000) {
    Date.now = function () {
        const da = execSync('date');
        console.log(`in now - OS date ${da}`)
        console.log(`in now OS date as JS ${new Date(da).toISOString()}`)
        const d = Date.parse(da)
        return d;
    }
}
console.log("After fixing Date.now() through override:")
console.log(`Date according to Node: ${new Date()}`)
console.log(`result of Date.now():  ${Date.now()}`)

And here is the outcome of running that code:

image


The post Override Date.now() based on OS time when Node returns incorrect current date appeared first on AMIS Oracle and Java Blog.
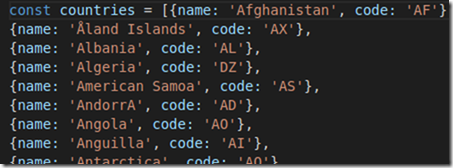
The size of Docker images containing OpenJDK 11.0.6

$
0
0

When running Java applications in containers, you need to be careful with your resources. If you’re not careful with layering your images (for example using Google’s Jib), you can quickly get into disk-space issues, especially when your base image and/or application gets updated regularly. One of the ways you can save resources is by using small base images. In this blog post I determined the uncompressed size of several base images containing OpenJDK 11.0.6 which are available on Docker Hub.

Used script

I used the following Bash script to determine the size of the downloaded images (uncompressed / on my disk) and version of bundled OS libraries. Be careful when running it for yourself! The script cleans your Docker environment.

strings=(
adoptopenjdk:11.0.6_10-jdk-hotspot-bionic
azul/zulu-openjdk-alpine:11.0.6
azul/zulu-openjdk:11.0.6
openjdk:11.0.6-slim
openjdk:11.0.6-jdk-slim-buster
adoptopenjdk/openjdk11:x86_64-ubi-minimal-jdk-11.0.6_10
adoptopenjdk/openjdk11:jdk-11.0.6_10-ubuntu-slim
adoptopenjdk/openjdk11:jdk-11.0.6_10-slim
adoptopenjdk/openjdk11:jdk-11.0.6_10-ubuntu
adoptopenjdk/openjdk11:jdk-11.0.6_10
adoptopenjdk/openjdk11:jdk-11.0.6_10-ubi-minimal
adoptopenjdk/openjdk11:jdk-11.0.6_10-ubi-slim
adoptopenjdk/openjdk11:jdk-11.0.6_10-ubi
adoptopenjdk/openjdk11:jdk-11.0.6_10-debianslim-slim
adoptopenjdk/openjdk11:jdk-11.0.6_10-debianslim
adoptopenjdk/openjdk11:jdk-11.0.6_10-debian-slim
adoptopenjdk/openjdk11:jdk-11.0.6_10-debian
adoptopenjdk/openjdk11:jdk-11.0.6_10-centos-slim
adoptopenjdk/openjdk11:jdk-11.0.6_10-centos
adoptopenjdk/openjdk11:jdk-11.0.6_10-alpine-slim
adoptopenjdk/openjdk11:jdk-11.0.6_10-alpine
mcr.microsoft.com/java/jdk:11u6-zulu-alpine
mcr.microsoft.com/java/jdk:11u6-zulu-centos
mcr.microsoft.com/java/jdk:11u6-zulu-debian10
mcr.microsoft.com/java/jdk:11u6-zulu-debian8
mcr.microsoft.com/java/jdk:11u6-zulu-debian9
mcr.microsoft.com/java/jdk:11u6-zulu-ubuntu
)

for i in "${strings[@]}"; do
echo "$i" >> output.txt
docker run --name jdk -it "$i" cat /etc/os-release | grep PRETTY_NAME | tail -n1 >> output.txt
docker images | awk '{print $NF}' | tail -n1 >> output.txt
docker stop `docker ps -qa`
docker rm `docker ps -qa`
docker rmi -f `docker images -qa `
docker volume rm $(docker volume ls -qf)
docker network rm `docker network ls -q`
done

dos2unix output.txt
cat output.txt | paste -d, - - -;

For the JRE variants I used the same script with the following list of images:

openjdk:11.0.6-jre-buster
openjdk:11.0.6-jre
openjdk:11.0.6-jre-slim-buster
openjdk:11.0.6-jre-slim
openjdk:11.0.6-jre-stretch
adoptopenjdk:11.0.6_10-jre-openj9-0.18.1
adoptopenjdk:11.0.6_10-jre-hotspot
adoptopenjdk:11.0.6_10-jre-openj9-0.18.1-bionic
adoptopenjdk:11.0.6_10-jre-hotspot-bionic
adoptopenjdk/openjdk11:jre-11.0.6_10-ubuntu
adoptopenjdk/openjdk11:jre-11.0.6_10
adoptopenjdk/openjdk11:jre-11.0.6_10-ubi-minimal
adoptopenjdk/openjdk11:jre-11.0.6_10-ubi
adoptopenjdk/openjdk11:jre-11.0.6_10-debianslim
adoptopenjdk/openjdk11:jre-11.0.6_10-debian
adoptopenjdk/openjdk11:jre-11.0.6_10-centos
adoptopenjdk/openjdk11:jre-11.0.6_10-alpine
adoptopenjdk/openjdk11:x86_64-alpine-jre-11.0.6_10
adoptopenjdk/openjdk11:x86_64-debian-jre-11.0.6_10
adoptopenjdk/openjdk11:x86_64-debianslim-jre-11.0.6_10
adoptopenjdk/openjdk11:x86_64-ubi-jre-11.0.6_10
adoptopenjdk/openjdk11:x86_64-ubi-minimal-jre-11.0.6_10
adoptopenjdk/openjdk11:x86_64-centos-jre-11.0.6_10
adoptopenjdk/openjdk11:x86_64-ubuntu-jre-11.0.6_10
mcr.microsoft.com/java/jre:11u6-zulu-alpine
mcr.microsoft.com/java/jre:11u6-zulu-centos
mcr.microsoft.com/java/jre:11u6-zulu-debian8
mcr.microsoft.com/java/jre:11u6-zulu-debian9
mcr.microsoft.com/java/jre:11u6-zulu-debian10
mcr.microsoft.com/java/jre:11u6-zulu-ubuntu
azul/zulu-openjdk-alpine:11.0.6-jre

Results

As you can see

  • The Alpine Linux based images are smallest. 
  • The JRE images are smaller than the JDK images
  • The RHEL/CentOS based images are (generally) largest. 
  • The Microsoft images are generally larger than images with the same OS libraries from other suppliers which have been looked at. 
  • The difference between the largest and smallest image is about 3 times. 
  • The slim images, as their name implies, are smaller than their not so slim siblings.

Of course the images, although they all contain the same JDK, differ in functionality. The bigger ones probably have more tools available inside of them. Having a smaller image however, likely also makes it safer to use since there is less inside which can be abused.

The post The size of Docker images containing OpenJDK 11.0.6 appeared first on AMIS, Data Driven Blog.

Spring: Blocking vs non-blocking: R2DBC vs JDBC and WebFlux vs Web MVC

$
0
0

Spring Framework version 5, released in Sept 2017, introduced Spring WebFlux. A fully reactive stack. In Dec 2019 Spring Data R2DBC was released, an incubator to integrate relational databases using a reactive driver. In this blog post I’ll show that at high concurrency, WebFlux and R2DBC perform better. They have better response times and higher throughput. As additional benefits, they use less memory and CPU per request processed and (when leaving out JPA in case of R2DBC) your fat JAR becomes a lot smaller. At high concurrency using WebFlux and R2DBC (if you do not need JPA) is a good idea!

Method

In this blog post I’ve looked at 4 implementations

  • Spring Web MVC + JDBC database driver
  • Spring Web MVC + R2DBC database driver
  • Spring WebFlux + JDBC database driver
  • Spring WebFlux + R2DBC database driver

I’ve varied the number of requests in progress (concurrency) from 4 to 500 in steps of 50 and assigned 4 cores to the load generator and to the service (my laptop has 12 cores). I’ve configured all connection pools to be 100. Why a fixed number of cores and connection pool size? In a previous exploration of JDBC vs R2DBC data changing those variables did not provide much additional insight so I decided to keep them fixed for this test reducing the duration of my test run by several factors.

I did a GET request on the service. The service fetched 10 records from the database and returned them as JSON. First I ‘primed’ the service for 2 seconds by putting heavy load on the service. Next I started with a 1 minute benchmark. I repeated every scenario 5 times (separated by other tests, so not 5 times after each other) and averaged the results. I only looked at the runs which did not cause errors. When I increased concurrency to more than 1000, the additional concurrent requests failed without exception for all implementations. The results appeared reproducible.

As back end database I’ve used Postgres (12.2). I used wrk to benchmark the implementations (because of several recommendations). I parsed wrk output using the following here. I measured

  • Response time
    As reported by wrk
  • Throughput (number of requests)
    As reported by wrk
  • Process CPU usage
    User and kernel time (based on /proc/PID/stat)
  • Memory usage
    Private and shared process memory (based on /proc/PID/maps)

You can view the test script used here. You can view the implementations used here.

Results

You can view the raw data which I used for the graphs here.

Response time

Response time [ms] on the y-axis and concurrency on the x-axis

It is clear that at higher concurrency, Spring Web MVC + JDBC might not be your best choice. R2DBC clearly gives the better response times at higher concurrency. Spring WebFlux also does better than a similar implementation using Spring Web MVC.

Throughput

Number of requests processed in 60 seconds on the y-axis and concurrency on the x-axis

Similar to the response times, Spring Web MVC with JDBC starts doing worse at higher concurrency. R2DBC clearly does best. Moving from Spring Web MVC to Spring WebFlux however also helps improving throughput but not as much as going from JDBC to R2DBC. At low concurrency, Spring Web MVC + JDBC does slightly better than Spring WebFlux + JDBC.

CPU

CPU was measured as CPU time during the entire run, the sum of process user and kernel time.

Concurrency on the x-axis and CPU usage on the y-axis 

Spring WebFlux used more CPU than Spring MVC and R2DBC used more CPU than JDBC. However when you look at the CPU used per request processed, you get a better idea why the non-blocking parts cause higher CPU usage:

CPU seconds (user + kernel) per request processed on the y-axis, concurrency on the x-axis.

WebFlux and R2DBC use less CPU per request than their blocking alternatives at high concurrency. As you have seen in the throughput graph, they are able to process more requests using the same amount of CPU resources! At low concurrency however Web MVC + JDBC makes most efficient use of available memory. Memory usage per request processed, when any component is non-blocking (WebFlux of R2DBC is used), is more stable than a completely blocking stack (Web MVC + R2DBC).

Memory

Memory was measured as process private memory at the end of the run. Memory usage is garbage collection dependent. G1GC was used on JDK 11.0.6. Xms was 0.5 Gb (default 1/64 of my available 32 Gb). Xmx was 8 Gb (default 1/4 of my available 32 Gb).

Memory usage [Mb] on the y-axis and concurrency on the x-axis

Similar to the CPU usage, the additional memory usage of WebFlux / R2DBC is caused by higher throughput. At low concurrency, Web MVC + JDBC does best but at higher concurrency, WebFlux + R2DBC uses less memory per processed request.

Memory [Kb] per request on the y-axis. Concurrency on the x-axis.

Fat JAR size

The below graph shows JPA is a big one. If you can’t use it in case of R2DBC, your fat JAR size drops in the order of 15Mb!

Summary

R2DBC and WebFlux, a good idea at high concurrency!

  • At high concurrency, the benefits of using R2DBC instead of JDBC and WebFlux instead of Web MVC are obvious. 
    • Less CPU is required to process a single request. 
    • Less memory required to process a single request. 
    • Response times at high concurrency are better.
    • Throughput at high concurrency is better
    • The fat JAR size is smaller (no JPA with R2DBC)
  • When using only WebFlux or R2DBC at high concurrency, CPU and memory required to process a single request are more or less stable. A completely blocking stack becomes less efficient at high concurrency.
  • You’re not required to have a completely non-blocking stack to reap the benefits of using R2DBC or WebFlux. It is however best to use both at high concurrency.
  • At low concurrency (somewhere below 200 concurrent requests), using Web MVC and JDBC, might give better results. Test this to determine your own break-even point!

Some challenges when using R2DBC

  • JPA cannot deal with reactive repositories such as provided by Spring Data R2DBC. This means you will have to do more things manually when using R2DBC.
  • There are other reactive drivers around such as for example Quarkus Reactive Postgres client (which uses Vert.x). This does not use R2DBC and has different performance characteristics (see here).
  • Limited availability
    Not all relational databases have reactive drivers available. For example, Oracle does not (yet?) have an R2DBC implementation. 
  • Application servers still depend on JDBC.
    Do people still use those for non-legacy in this Kubernetes age?
  • When Java Fibers will be introduced (Project Loom, could be Java 15), the driver landscape might change again and R2DBC might not become JDBCs successor after all.

The post Spring: Blocking vs non-blocking: R2DBC vs JDBC and WebFlux vs Web MVC appeared first on AMIS, Data Driven Blog.

Azure Pipelines: How to build and test an Angular and Node.js webapp and deploy it to on-premise VM’s using multiple stages (YAML) – Overview

$
0
0

What is Azure Pipelines?

Azure pipelines is a free continuous integration/continuous delivery tool from Azure Devops (Microsoft). Not only can it deploy to the azure cloud, it can also deploy to self hosted VMs. Even multiple, with multiple stages. For instance, an Acceptance, Test and Production environment. All of this can be done in YAML files.

Why (Azure) Pipelines?

Pipelines are a great way to manage your tests and deployment. It’s all automatic. If you push a commit to for say, master, it will run the tests (you would’ve run manually otherwise) and deploy to your environment automatically. This gives your team trust in deploying, because there’s consistency. It also gives you feedback about the deployment.

Why Azure? It has cloud native support. So if you ever think of switching from on-premise VM’s to the cloud, that’s super easy. This is especially interesting for my project.
Furthermore can it work with almost any language/platform. This makes it easier to change some components of your stack. It is also cross-platform.
At last is the documentation is very good and almost everything can be written in YAML. See also Microsoft’s views on it.

My environment and the requirements

I have three of on-premise VM’s with the following requirements for each environment

  • Acceptance – automatic deployment allowed (to see if it just works)
  • Test – only manual deployment (final checks before deploying for production)
  • Production – only manual deployment

For the frontend I am using Angular 7. For the backend I am using Node.js.
The pipeline has to run the tests made by the developers. The results have to be showed in a dashboard.

The backend and frontend have to be run in the same pipeline, because the backend and frontend are in the same repository. My folder structure looks like this

├──backend
│  ├──node_modules
│  ├──src
│  └──test
└──frontend
   ├──dist
   ├──node_modules
   └──src

Blog posts layout

In the following five blog posts I am going to show how to deploy multiple environments to self-hosted VMs. The posts will be divided into six parts:

  1. Using and set up a webapp in Azure Pipelines
  2. Build Angular and Node.js webapp in Azure Pipelines
  3. Test Angular and Node.js webapp in Azure Pipelines
  4. Set up on-premise VM’s using multiple stages in Azure
  5. Deploy Angular and Node.js webapp in Azure Pipelines

In the end you will have a pipeline that builds the artifacts in the. The self-hosted VMs will pull those artifacts and deploy them.

The post Azure Pipelines: How to build and test an Angular and Node.js webapp and deploy it to on-premise VM’s using multiple stages (YAML) – Overview appeared first on AMIS, Data Driven Blog.

Azure Pipelines: Using and set up a webapp (part 1)

$
0
0

This will be the first part 5 part series about Azure Pipelines. In this first part I will explain to you how to set up your Azure Pipeline so it’s capable of deploying a Node.js and Angular webapp. We will use Node for the backend and Angular for the frontend.

Create your Azure Pipeline

First you have to create a pipeline. You can do this by going to Azure Devops. Create a new project and go to the pipelines tab. If you don’t see this tab, enable it. Do so by following the steps in this link:

Configure your git source and for now add an starter pipeline YAML. This azure-pipelines.yml will be added to your repo, so make sure to pull. Make sure it’s pushed on your own separate branch if you don’t want it to be on your master (it’s configured to push to master by default)

Multi-stage Pipelines

Second thing you have to do, is enable multi-stage pipelines. You can do this by doing the following:

Click on the user icon with settings. Next click on preview features
Switch on the multi-stage pipelines switch

This enables you to have multiple stages, which comes in handy when you want to divide the deploying stages. See also here for the documentation.
Your yaml should now look like this:

# Starter pipeline
# Start with a minimal pipeline that you can customize to build and deploy your code.
# Add steps that build, run tests, deploy, and more:
# https://aka.ms/yaml

trigger:
- master

pool:
  vmImage: 'ubuntu-latest'

steps:
- script: echo Hello, world!
  displayName: 'Run a one-line script'

- script: |
    echo Add other tasks to build, test, and deploy your project.
    echo See https://aka.ms/yaml
  displayName: 'Run a multi-line script'

You will be able to run your pipeline, but it won’t do much yet. Let’s change that! Continue in the next article.

The post Azure Pipelines: Using and set up a webapp (part 1) appeared first on AMIS, Data Driven Blog.

Azure Pipeline: Build Angular and Node.js webapp (part 2)

$
0
0

In the previous article, we discussed how we can set up a pipeline with multiple stages in Azure Pipelines. In this article we will discuss how we can build the Angular and Node.js apps in the pipeline itself.
I usually put all the build processes in one stage. In that stage I have one job for the backend and one job for the frontend. Check out the Azure documentation on basics about the azure pipelines.

My folder structure

My project has a backend and frontend folder in the same repository. So I am using one pipeline. Of course you can use multiple pipelines if you have two separate repositories this (that is usually done), but you can also put it in one pipeline.
My project looks like this:
├──backend
│  ├──node_modules
│  ├──src
│  └──test
└──frontend
   ├──dist
   ├──node_modules
   └──src

Angular – Building the frontend

First, we’re going to build the backend in the pipeline. It’s not much different than doing it from localhost.
At first, we will install the dependencies, then build the angular app and at last publish the build files to the pipeline.
You can choose to use yarn or npm for this project, but npm is supported by default and yarn is not. I will use npm tasks, but I will show you how to use yarn tasks too.

We install the dependencies with npm. We can use an azure pipeline tasks for this. Not all tasks will work for YAML pipelines, but you can use this handy toolbar that shows you which tasks are supported.

Shows a toolbar on the right that displays all the tasks availabe

I will use this npm task. Instead of a npm install, I’m using npm ci. Read some more about npm ci here. You will want to use npm ci in CI/CD pipelines, so your package management will be more consistent. You can add the task to a job by using the steps keyword. See a code example below.

After pulling the dependencies we will want to build the app. You can do this by using the build command from Angular.
We can run the ng build command with a bash task. We use ‘npm run ng build’ instead of ‘ng build’, because it will error on ‘ng is not installed’ if you use the ng command directly.

At last we will want to publish the files to the pipeline. You can do this by publishing the frontend folder to the pipeline. There’s also a task for that.
In the end your yaml looks like this:

trigger:
- master

pool:
  vmImage: 'ubuntu-latest'

stages:
  - stage: Build
    jobs:
      - job: Frontend
        steps:
        - task: Npm@1
          inputs:
            command: 'ci'
            workingDir: '$(System.DefaultWorkingDirectory)/frontend'
        - task: Bash@3
          inputs:
            targetType: 'inline'
            script: 'npm run ng build'
            workingDirectory: '$(System.DefaultWorkingDirectory)/frontend'
        - task: PublishPipelineArtifact@1
          inputs:
            targetPath: '$(Pipeline.Workspace)/frontend/dist'
            artifact: 'frontend'
            publishLocation: 'pipeline'

The workingDir is the directory where the command executes. The $(System.DefaultWorkingDirectory) variable is a predefined variable by Azure. Read more about the predefined variables here. They’re really handy!

Yarn instead of npm

If you want to use yarn instead of npm, you can use the same bash command. You can do an yarn –frozen-lockfile as follows

- task: Bash@3
  inputs:
    targetType: 'inline'
    script: 'yarn install --frozen-lockfile'

Node.js – Build the backend

Now that we’ve build and published the frontend, we can build the backend. Since it uses node, it’s very similar. You can also, of course, use different backend languages like Java or C#. You can find the tasks for that in the task index I referenced earlier.

We will do the same as in the frontend, install dependencies, build project and publish it to the pipeline. Your yaml will look like this

trigger:
  - master
  
pool:
  vmImage: 'ubuntu-latest'
  
stages:
  - stage: Build
    jobs:
      - job: Frontend
        steps:
        - task: Npm@1
          inputs:
            command: 'ci'
            workingDir: '$(System.DefaultWorkingDirectory)/frontend'
        - task: Bash@3
          inputs:
            targetType: 'inline'
            script: 'npm run ng build'
            workingDirectory: '$(System.DefaultWorkingDirectory)/frontend'
        - task: PublishPipelineArtifact@1
          inputs:
            targetPath: '$(Pipeline.Workspace)/frontend'
            artifact: 'frontend'
            publishLocation: 'pipeline'
      - job: Backend
        steps:
        - task: Npm@1
          inputs:
            command: 'ci'
            workingDir: '$(System.DefaultWorkingDirectory)/backend'
        - task: Bash@3
          inputs:
            targetType: 'inline'
            script: 'npm run build'
            workingDirectory: '$(System.DefaultWorkingDirectory)/backend'
        - task: PublishPipelineArtifact@1
          inputs:
            targetPath: '$(Pipeline.Workspace)/backend'
            artifact: 'backend'
            publishLocation: 'pipeline'

In the next article we will discuss how we can integrate tests in the pipeline. I will show you how to run the tests, how to get the test coverage and how to publish a summary of the tests.

The post Azure Pipeline: Build Angular and Node.js webapp (part 2) appeared first on AMIS, Data Driven Blog.


Add tests for Angular and Node.js webapp in Azure Pipelines (part 3)

$
0
0

In the previous article I showed how to build a webapp in the Azure pipeline. In this article I will explain to you how you run tests in your pipeline. I will show you how to do this for both Angular and Node.js.

Adding tests frontend – Angular

Adding tests to the frontend is a bit harder than for the backend, so will we start out with this.
This article helped me out a lot by adding tests to Angular. I will cover what Oliver said in that article and add some more about how to improve performance.

Adding code coverage

First we will want to add the Cobertura reporter to karma.conf.js by doing the following

module.exports = function (config) {
...
    coverageIstanbulReporter: {
      dir: require('path').join(__dirname, '../coverage'),
      reports: ['html', 'lcovonly', 'text-summary', 'cobertura'],
      fixWebpackSourcePaths: true
    },
...
};

Next you will want to install the following three packages as dev dependencies, so the tests can run headless.

  • Puppeteer
  • Karma-jasmine-html-reporter
  • Karma-spec-reporter

Now you will want to edit the karma.conf.js again so it uses puppeteer. Make it so it looks something like this. The highlighted line are the lines that have been changed.

module.exports = function (config) {
  const puppeteer = require('puppeteer');
  process.env.CHROME_BIN = puppeteer.executablePath();

  config.set({
    basePath: '',
    frameworks: ['jasmine', '@angular-devkit/build-angular'],
    plugins: [
      require('karma-jasmine'),
      require('karma-chrome-launcher'),
      require('karma-jasmine-html-reporter'),
      require('karma-coverage-istanbul-reporter'),
      require('@angular-devkit/build-angular/plugins/karma')
    ],
    client: {
      clearContext: false // leave Jasmine Spec Runner output visible in browser
    },
    coverageIstanbulReporter: {
      dir: require('path').join(__dirname, '../coverage'),
      reports: ['html', 'lcovonly', 'text-summary', 'cobertura'],
      fixWebpackSourcePaths: true
    },
    reporters: ['progress', 'kjhtml'],
    port: 9876,
    colors: true,
    logLevel: config.LOG_INFO,
    autoWatch: true,
    browsers: ['ChromeHeadless'],
    singleRun: false
  });
};

The code coverage problem

For the code coverage, we want the backend as well as the frontend reported. The problem is, that azure overrides the code coverage files when a new coverage file is uploaded. See here. Now there’s a solution for that (until Microsoft fixes this issue). We can use an custom reporter made by a guy named Daniel palm. This reporter can merge files, in contrary to Azure’s reporter.
You can install his report generator from the marketplace from here. Now you can use it in your pipeline.
Run the tests and create the code coverage file like so:

- task: DeleteFiles@1
  displayName: 'Delete JUnit files'
  inputs:
    SourceFolder: '$(System.DefaultWorkingDirectory)/frontend/junit'
    Contents: 'TESTS*.xml'
- task: Npm@1
  displayName: 'Test Angular'
  inputs:
    command: custom
    customCommand: run test -- --watch=false --code-coverage
    workingDir: '$(System.DefaultWorkingDirectory)/frontend'
- task: Palmmedia.reportgenerator.reportgenerator-build-release-task.reportgenerator@4
  displayName: ReportGenerator
  inputs:
    reports: '$(Build.SourcesDirectory)/frontend/coverage/cobertura-coverage.xml'
    targetdir: '$(Build.SourcesDirectory)/frontend/coverage'
    reporttypes: 'Cobertura'
    assemblyfilters: '-xunit*'
- task: PublishPipelineArtifact@1
  inputs:
    targetPath: '$(Build.SourcesDirectory)/frontend/coverage'
    artifact: 'frontendCoverage'

We’re first running a deleteFiles task, to make sure the leftover files from the previous build don’t mess up the new results.
Next we’re publishing the coverage as an artifact (yes this is just one file), so we can use it later on when we’re publishing the codeCoverage.

Adding the test summary

For the tests we will just use the ng test command. We’re going to use a junit reporter. Install it by running

npm install karma-junit-reporter --save-dev

Next, add the junit reporter to the karma config by adding the following to the karma.conf.js:

require('karma-jasmine'),
require('karma-chrome-launcher'),
require('karma-jasmine-html-reporter'),
require('karma-coverage-istanbul-reporter'),
require('@angular-devkit/build-angular/plugins/karma'),
require('karma-junit-reporter')
reporters: ['progress', 'kjhtml', 'junit'],
junitReporter: {
    outputDir: './junit'
},

Last, add the tests results to the pipeline by adding this to the azure-pipelines.yml:

- task: PublishTestResults@2
  displayName: 'Publish Angular test results'
  condition: succeededOrFailed()
  inputs:
    testResultsFormat: 'JUnit'
    testResultsFiles: '$(System.DefaultWorkingDirectory)/frontend/junit/TESTS-*.xml'
    searchFolder: '$(System.DefaultWorkingDirectory)/frontend/junit'
    testRunTitle: 'Frontend mocha tests'

Improving performance

In my experience, the performance of the tests is very, very slow. For me it sometimes takes up to two whole minutes to complete the tests. Sadly, this is mainly caused by the angular compiler itself. There are some ways to reduce the build time a bit, but for me it didn’t help much. The test time was still reduced by 20 seconds though. So you might consider it.
This article explains very well how why the tests are so slow in detail. It also explains how to solve this. This article also shows some ways to speed the process up.
Basically the main thing is that for every test, Angular creates an TestBed. You can also instantiate this TestBed just one time and run it for every test. In the provided article zshuffield used Ng-Bullet. You can use Ng-bullet by installing it and changing the test code to look like the following:

ng-bullet component

The disadvantage of creating a TestBed just one time, is that code can mess up at runtime. I would only recommend trying to increase the test time if you have a lot of tests. Think of thousands of tests.

Adding tests backend – Node.js

Adding tests to the backend is considerably easier than for the frontend. To accomplish this I used the answer from crimbo from this stackoverflow post.
If you’ve not installed jest yet, do so now and add some tests.
Then install the jest-junit package in the backend folder

npm add --save-dev jest-junit

Adding code coverage

We will make a script in package.json that runs the test coverage. Add the following under scripts:

"test-azure-coverage": "jest --coverage --coverageReporters=cobertura --forceExit"

Now add the reporters to the jest config. Check the documentation here.

  "jest": {
    "reporters": [
      "default",
      "jest-junit"
    ],

Next you add the script, run the reporter (the palm reporter), add it to the pipeline and publish it. You can do this by adding the following to the azure-pipelines.yml:

- task: Npm@1
  displayName: run test backend coverage
  inputs:
    command: 'custom'
    workingDir: 'backend'
    customCommand: 'run test-azure-coverage'
- task: Palmmedia.reportgenerator.reportgenerator-build-release-task.reportgenerator@4
  displayName: ReportGenerator
  inputs:
    reports: '$(Build.SourcesDirectory)/backend/coverage/cobertura-coverage.xml'
    targetdir: '$(Build.SourcesDirectory)/backend/coverage'
    reporttypes: 'Cobertura'
    assemblyfilters: '-xunit*'
- task: PublishPipelineArtifact@1
  inputs:
    targetPath: '$(Build.SourcesDirectory)/backend/coverage'
    artifact: 'backendCoverage'

Adding the test summary

To add the test summary we again add a script to the package.json

"test-azure-report": "jest --ci --reporters=default --reporters=jest-junit --forceExit",

This should run the summary. The ci flag is for the continuous integration. I added the forceExit, so it exits when it’s done. See here for the documentation

Next add the test command to the pipeline and publish the result by adding the following to the azure-pipelines.yml:

- task: Npm@1
  displayName: run test backend report
  inputs:
    command: 'custom'
    workingDir: 'backend'
    customCommand: 'run test-azure-report'
- task: PublishTestResults@2
  inputs:
    testResultsFormat: 'JUnit'
    testResultsFiles: 'junit.xml'
    searchFolder: '$(Build.SourcesDirectory)/backend'
    testRunTitle: 'Run backend jest tests'

Publishing the code coverage

We’ve published both the frontend and the backend as an artifact. Now we’re going to use these artifacts to publish the coverage altogether.

We do so by adding the following steps to a new job in the azure-pipelines.yml:

- job: codeCoverage
  displayName: publish code coverage
  dependsOn:
   - Frontend
   - Backend
  steps:
    - checkout: none
    - task: DownloadPipelineArtifact@2
      inputs:
        artifact: backend        
        path: $(Pipeline.Workspace)/backend/backend
        itemPattern: '!node_modules/**'
    - task: DownloadPipelineArtifact@2
      inputs:
        artifact: frontend
        path: $(Pipeline.Workspace)/frontend/frontend
        itemPattern: '!node_modules/**'
    - download: current
      artifact: backendCoverage
    - download: current
      artifact: frontendCoverage
    - task: Palmmedia.reportgenerator.reportgenerator-build-release-task.reportgenerator@4
      displayName: ReportGenerator
      inputs:
        reports: '$(Pipeline.Workspace)/backendCoverage/Cobertura.xml;$(Pipeline.Workspace)/frontendCoverage/Cobertura.xml'
        targetdir: '$(Pipeline.Workspace)/coverage'
        reporttypes: 'HtmlInline_AzurePipelines;Cobertura'
    - task: PublishCodeCoverageResults@1
      inputs:
        codeCoverageTool: 'Cobertura'
        summaryFileLocation: '$(Pipeline.Workspace)/coverage/*.xml'
        reportDirectory: '$(Pipeline.Workspace)/coverage'

This job downloads the two source code artifacts (this is needed for reference in the code coverage report later on) and downloads the two generated report files.
Notice how I don’t download the node_modules folder, because this is not necessary and is a very large folder.
We use the report generator job from Palm again to generate the final report in html. We publish this report with the PublishCodeCoverageResults task. Your result after running the pipeline should look something like this:

Notice the 2x CoberturaParser by the code coverage report in the azure pipeline

Notice the (2x) at the parser, this indicates that it has combined two reports into 1 report.

And we’re done! This should add backend and frontend tests and code coverage to your Azure pipeline. In the next article I will explain how you can combine on-premise VM’s with the multiple stage environment, so you can have your environments set up so deployments can only be done by manual approval.

Your code in the end should now look like this. I highlighted the lines that have been added compared to the previous file. Don’t forgot to make the changes to the other files as well!

trigger:
  - master
  
pool:
  vmImage: 'ubuntu-latest'
  
stages:
  - stage: Build
    jobs:
      - job: Frontend
        steps:
          - task: Npm@1
            inputs:
              command: 'ci'
              workingDir: '$(System.DefaultWorkingDirectory)/frontend'
          - task: Bash@3
            inputs:
              targetType: 'inline'
              script: 'npm run ng build'
              workingDirectory: '$(System.DefaultWorkingDirectory)/frontend'
          - task: DeleteFiles@1
            displayName: 'Delete JUnit files'
            inputs:
              SourceFolder: '$(System.DefaultWorkingDirectory)/frontend/junit'
              Contents: 'TESTS*.xml'
          - task: Npm@1
            displayName: 'Test Angular'
            inputs:
              command: custom
              customCommand: run test -- --watch=false --code-coverage
              workingDir: '$(System.DefaultWorkingDirectory)/frontend'
          - task: Palmmedia.reportgenerator.reportgenerator-build-release-task.reportgenerator@4
            displayName: ReportGenerator
            inputs:
              reports: '$(Build.SourcesDirectory)/frontend/coverage/cobertura-coverage.xml'
              targetdir: '$(Build.SourcesDirectory)/frontend/coverage'
              reporttypes: 'Cobertura'
              assemblyfilters: '-xunit*'
          - task: PublishTestResults@2
            displayName: 'Publish Angular test results'
            condition: succeededOrFailed()
            inputs:
              testResultsFormat: 'JUnit'
              testResultsFiles: '$(System.DefaultWorkingDirectory)/frontend/junit/TESTS-*.xml'
              searchFolder: '$(System.DefaultWorkingDirectory)/frontend/junit'
              testRunTitle: 'Frontend mocha tests'
          - task: PublishPipelineArtifact@1
            inputs:
              targetPath: '$(Build.SourcesDirectory)/frontend/coverage'
              artifact: 'frontendCoverage'
          - task: PublishPipelineArtifact@1
            inputs:
              targetPath: '$(Pipeline.Workspace)/frontend'
              artifact: 'frontend'
              publishLocation: 'pipeline'


      - job: Backend
        steps:
          - task: Npm@1
            inputs:
              command: 'ci'
              workingDir: '$(System.DefaultWorkingDirectory)/backend'
          - task: Bash@3
            inputs:
              targetType: 'inline'
              script: 'npm run build'
              workingDirectory: '$(System.DefaultWorkingDirectory)/backend'
          - task: Npm@1
            displayName: run test backend report
            inputs:
              command: 'custom'
              workingDir: 'backend'
              customCommand: 'run test-azure-report'
          - task: Npm@1
            displayName: run test backend coverage
            inputs:
              command: 'custom'
              workingDir: 'backend'
              customCommand: 'run test-azure-coverage'
          - task: Palmmedia.reportgenerator.reportgenerator-build-release-task.reportgenerator@4
            displayName: ReportGenerator
            inputs:
              reports: '$(Build.SourcesDirectory)/backend/coverage/cobertura-coverage.xml'
              targetdir: '$(Build.SourcesDirectory)/backend/coverage'
              reporttypes: 'Cobertura'
              assemblyfilters: '-xunit*'
          - task: PublishTestResults@2
            inputs:
              testResultsFormat: 'JUnit'
              testResultsFiles: 'junit.xml'
              searchFolder: '$(Build.SourcesDirectory)/backend'
              testRunTitle: 'Run backend jest tests'
          - task: PublishPipelineArtifact@1
            inputs:
              targetPath: '$(Build.SourcesDirectory)/backend/coverage'
              artifact: 'backendCoverage'
          - task: PublishPipelineArtifact@1
            inputs:
              targetPath: '$(Pipeline.Workspace)/backend'
              artifact: 'backend'
              publishLocation: 'pipeline'


      - job: codeCoverage
        displayName: publish code coverage
        dependsOn:
          - Frontend
          - Backend
        steps:
          - checkout: none
          - task: DownloadPipelineArtifact@2
            inputs:
              artifact: backend        
              path: $(Pipeline.Workspace)/backend/backend
              itemPattern: '!node_modules/**'
          - task: DownloadPipelineArtifact@2
            inputs:
              artifact: frontend
              path: $(Pipeline.Workspace)/frontend/frontend
              itemPattern: '!node_modules/**'
          - download: current
            artifact: backendCoverage
          - download: current
            artifact: frontendCoverage
          - task: Palmmedia.reportgenerator.reportgenerator-build-release-task.reportgenerator@4
            displayName: ReportGenerator
            inputs:
              reports: '$(Pipeline.Workspace)/backendCoverage/Cobertura.xml;$(Pipeline.Workspace)/frontendCoverage/Cobertura.xml'
              targetdir: '$(Pipeline.Workspace)/coverage'
              reporttypes: 'HtmlInline_AzurePipelines;Cobertura'
          - task: PublishCodeCoverageResults@1
            inputs:
              codeCoverageTool: 'Cobertura'
              summaryFileLocation: '$(Pipeline.Workspace)/coverage/*.xml'
              reportDirectory: '$(Pipeline.Workspace)/coverage'

The post Add tests for Angular and Node.js webapp in Azure Pipelines (part 3) appeared first on AMIS, Data Driven Blog.
On-premise VM’s and Azure Pipelines: Set up with multiple stages in Azure Pipelines (part 4)

$
0
0

In the previous article we discussed how we can build a pipeline and at some tests to it. In this article we’re going to discuss how we can set up the on-premise VM’s so that we can deploy the artifacts to them. You can also deploy the artifacts to an Azure Webapp. I recommend doing this if you’re starting from scratch, but if you can’t and would like to run them on on-premise VM’s, this is the right article.

Environment setup

On my setup I have three VM’s:

  • Acceptance – automatic deployment allowed (to see if it just works)
  • Test – only manual deployment (finals checks before deploying for production)
  • Production – only manual deployment

This means that I want to deploy my backend and frontend artifact to different VM’s. Luckily, azure has a solution for this! Azure enviroments.
Azure calls a set of VM’s that deploy the same code, an environment.
In combination with the deployment jobs you can specify to which VM you want to deploy. You can add checks to those environments so you can only allow manual deployments!

To use those environments we have to register one of the on-premise VM’S to an environment. You can do this by first creating an environment:

Select virtual machines
Select the copy function that shows up

Set up script

In the following code snippet I used most of the code from the copy function, but removed some commands (I don’t recommend running it interactively). Make sure you add your own token and url, you can copy this from the generated function (the copy icon):

export HOSTNAME=YOURHOSTNAME
export PROJECTNAME=YOURPROJECTNAME
export ORGANISATIONURL=https://dev.azure.com/YOURORGANISATIONNAMEGOESHERE

mkdir azagent;
cd azagent;

curl -fkSL -o vstsagent.tar.gz https://vstsagentpackage.azureedge.net/agent/2.166.3/vsts-agent-linux-x64-2.166.3.tar.gz;
tar -zxvf vstsagent.tar.gz;
./config.sh --deploymentgroup --deploymentgroupname "Service Portal Acceptance" --acceptteeeula --agent $HOSTNAME --url $ORGANISATIONURL --work _work --projectname $YOURPROJECTNAME--runasservice; 

sudo ./svc.sh install; 
sudo ./svc.sh start; 

Execute those functions. You might make an new user so you don’t run the new user from root. I run the service under the user pm2.

When the service is running, it should show up under your environments in the environments panel in Azure DevOps

This shows that the on-premise VM is available

Do this for all three environments. You change the hostname for every time you run the script. The final result will look like this:

This shows an overview of all the environments with all the on-premise VM's

Adding only manual deployment

Now for every environment you can enable checks. For production, we want only a manual deployment.
Click on the production environment -> Click on the three dots -> Click approvals and checks -> Plus button -> Approvals.

In the next menu you can configure who is allowed to deploy to production

This shows the screen where you can configure the approvers for a manual deployment for an on-premise VM

Do this for every environment you want it to (I applied it to production and test). In the next article I will explain how you can deploy the build artifacts to those environments.

The post On-premise VM’s and Azure Pipelines: Set up with multiple stages in Azure Pipelines (part 4) appeared first on AMIS, Data Driven Blog.
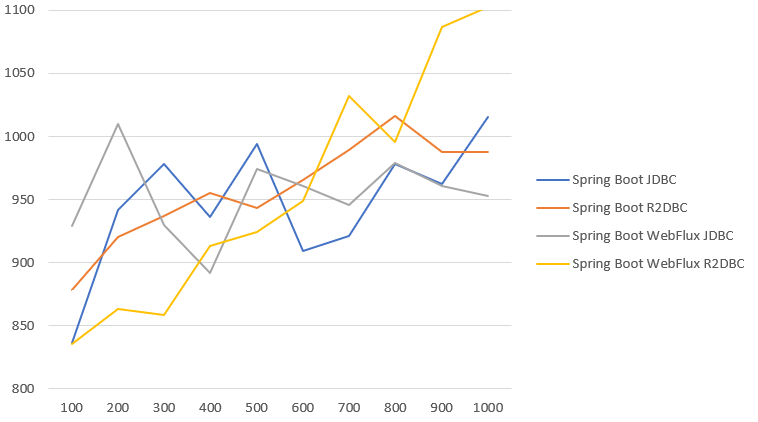
Deploy Angular and Node.js webapp in Azure Pipelines (part 5)

$
0
0

In the previous article I explained how to set up multiple environments for Azure Pipelines. In this article I will explain how you can deploy the artifacts to the on-premise VM’s. This are the artifacts you build in the pipeline. I am using an template for this, because we are using the same script three times. An template avoids code repetition.
I have three stages with a deployment job:

  • acceptance
  • test
  • production.

By defining the name of the environment it knows to which VM it needs to deploy. You can add a job with a task by adding the following to the azure-pipelines.yml

- stage: deployAcceptatie
displayName: Deploy Acceptatie
dependsOn: 
- Build
jobs:
  - deployment: VMDeploy_Acceptatie
    displayName: deploy Acceptatie
    environment:
      name: Service Portaal VM acceptatie
      resourceType: VirtualMachine
      tags: acceptatie
    strategy:
      runOnce:
        deploy:
          steps:
            - template: deploy.yml

Deploy with the deployment template

We use the task template. Create a new file called deploy.yml. I am using pm2 to run the node application. You could also use some other service like docker. This is very dependent on your VM and how your VM is configured (or what you want to use).

steps:
  - download: current
    displayName: Download backend
    artifact: 'backend'
  - task: DownloadPipelineArtifact@2
    displayName: Download frontend
    inputs:
      artifact: 'frontend'
      path: '$(Pipeline.Workspace)/frontend$'
      patterns: 'dist/**'
  - task: Bash@3
    displayName: Stop application
    inputs:
      targetType: 'inline'
      script: |
          export HOME=/home/pm2
          chown -R pm2:pm2 /home/azure_pipeline/
          su -c "pm2 stop all" -m "pm2"
      workingDirectory: '/opt/backend'
  - task: Bash@3
    displayName: Backend deploy
    inputs:
      targetType: 'inline'
      script: |
          mv -v $(Pipeline.Workspace)/backend/dist ./dist
          mv -v $(Pipeline.Workspace)/backend/node_modules ./node_modules
      workingDirectory: '/opt/backend'
  - task: Bash@3
    displayName: Frontend deploy
    inputs:
      targetType: 'inline'
      script: |
          mv -v $(Pipeline.Workspace)/frontend/* ./dist
      workingDirectory: '/opt/frontend'
  - task: Bash@3
    displayName: Start application
    inputs:
      targetType: 'inline'
      script: |
          export HOME=/home/pm2
          su -c "pm2 start all" -m "pm2"
      workingDirectory: '/opt/backend'

The highlighted code is the code specific to your VM. Do this for all the three environments. The final azure-pipelines.yml will look like this:

trigger:
  - master
  
pool:
  vmImage: 'ubuntu-latest'
  
stages:
  - stage: Build
    jobs:
      - job: Frontend
        steps:
          - task: Npm@1
            inputs:
              command: 'ci'
              workingDir: '$(System.DefaultWorkingDirectory)/frontend'
          - task: Bash@3
            inputs:
              targetType: 'inline'
              script: 'npm run ng build'
              workingDirectory: '$(System.DefaultWorkingDirectory)/frontend'
          - task: DeleteFiles@1
            displayName: 'Delete JUnit files'
            inputs:
              SourceFolder: '$(System.DefaultWorkingDirectory)/frontend/junit'
              Contents: 'TESTS*.xml'
          - task: Npm@1
            displayName: 'Test Angular'
            inputs:
              command: custom
              customCommand: run test -- --watch=false --code-coverage
              workingDir: '$(System.DefaultWorkingDirectory)/frontend'
          - task: Palmmedia.reportgenerator.reportgenerator-build-release-task.reportgenerator@4
            displayName: ReportGenerator
            inputs:
              reports: '$(Build.SourcesDirectory)/frontend/coverage/cobertura-coverage.xml'
              targetdir: '$(Build.SourcesDirectory)/frontend/coverage'
              reporttypes: 'Cobertura'
              assemblyfilters: '-xunit*'
          - task: PublishTestResults@2
            displayName: 'Publish Angular test results'
            condition: succeededOrFailed()
            inputs:
              testResultsFormat: 'JUnit'
              testResultsFiles: '$(System.DefaultWorkingDirectory)/frontend/junit/TESTS-*.xml'
              searchFolder: '$(System.DefaultWorkingDirectory)/frontend/junit'
              testRunTitle: 'Frontend mocha tests'
          - task: PublishPipelineArtifact@1
            inputs:
              targetPath: '$(Build.SourcesDirectory)/frontend/coverage'
              artifact: 'frontendCoverage'
          - task: PublishPipelineArtifact@1
            inputs:
              targetPath: '$(Pipeline.Workspace)/frontend'
              artifact: 'frontend'
              publishLocation: 'pipeline'


      - job: Backend
        steps:
          - task: Npm@1
            inputs:
              command: 'ci'
              workingDir: '$(System.DefaultWorkingDirectory)/backend'
          - task: Bash@3
            inputs:
              targetType: 'inline'
              script: 'npm run build'
              workingDirectory: '$(System.DefaultWorkingDirectory)/backend'
          - task: Npm@1
            displayName: run test backend report
            inputs:
              command: 'custom'
              workingDir: 'backend'
              customCommand: 'run test-azure-report'
          - task: Npm@1
            displayName: run test backend coverage
            inputs:
              command: 'custom'
              workingDir: 'backend'
              customCommand: 'run test-azure-coverage'
          - task: Palmmedia.reportgenerator.reportgenerator-build-release-task.reportgenerator@4
            displayName: ReportGenerator
            inputs:
              reports: '$(Build.SourcesDirectory)/backend/coverage/cobertura-coverage.xml'
              targetdir: '$(Build.SourcesDirectory)/backend/coverage'
              reporttypes: 'Cobertura'
              assemblyfilters: '-xunit*'
          - task: PublishTestResults@2
            inputs:
              testResultsFormat: 'JUnit'
              testResultsFiles: 'junit.xml'
              searchFolder: '$(Build.SourcesDirectory)/backend'
              testRunTitle: 'Run backend jest tests'
          - task: PublishPipelineArtifact@1
            inputs:
              targetPath: '$(Build.SourcesDirectory)/backend/coverage'
              artifact: 'backendCoverage'
          - task: PublishPipelineArtifact@1
            inputs:
              targetPath: '$(Pipeline.Workspace)/backend'
              artifact: 'backend'
              publishLocation: 'pipeline'


      - job: codeCoverage
        displayName: publish code coverage
        dependsOn:
          - Frontend
          - Backend
        steps:
          - checkout: none
          - task: DownloadPipelineArtifact@2
            inputs:
              artifact: backend        
              path: $(Pipeline.Workspace)/backend/backend
              itemPattern: '!node_modules/**'
          - task: DownloadPipelineArtifact@2
            inputs:
              artifact: frontend
              path: $(Pipeline.Workspace)/frontend/frontend
              itemPattern: '!node_modules/**'
          - download: current
            artifact: backendCoverage
          - download: current
            artifact: frontendCoverage
          - task: Palmmedia.reportgenerator.reportgenerator-build-release-task.reportgenerator@4
            displayName: ReportGenerator
            inputs:
              reports: '$(Pipeline.Workspace)/backendCoverage/Cobertura.xml;$(Pipeline.Workspace)/frontendCoverage/Cobertura.xml'
              targetdir: '$(Pipeline.Workspace)/coverage'
              reporttypes: 'HtmlInline_AzurePipelines;Cobertura'
          - task: PublishCodeCoverageResults@1
            inputs:
              codeCoverageTool: 'Cobertura'
              summaryFileLocation: '$(Pipeline.Workspace)/coverage/*.xml'
              reportDirectory: '$(Pipeline.Workspace)/coverage'

  - stage: deployAcceptance
    displayName: Deploy Acceptance
    dependsOn: 
    - Build
    jobs:
      - deployment: VMDeploy_Acceptance
        displayName: deploy Acceptance
        environment:
          name: Service Portaal VM acceptance
          resourceType: VirtualMachine
        strategy:
          runOnce:
            deploy:
              steps:
                - template: deploy.yml

  - stage: deployTest
    displayName: Deploy Test
    dependsOn: 
    - Build
    - deployAcceptatie
    jobs:
      - deployment: VMDeploy_Test
        displayName: deploy Test
        environment:
          name: Service Portaal VM test
          resourceType: VirtualMachine
        strategy:
          runOnce:
            deploy:
              steps:
                - template: deploy.yml

  - stage: deployProduction
    displayName: Deploy Production
    dependsOn: 
    - Build
    - deployAcceptance
    - deployTest
    jobs:
      - deployment: VMDeploy_Production
        displayName: deploy Production
        environment:
          name: Service Portaal VM productie
          resourceType: VirtualMachine
        strategy:
          runOnce:
            deploy:
              steps:
                - template: deploy.yml

Conditions

Now if you only want to deploy production with a push on master, we can add a condition. I am using the next condition.

- stage: deployProduction
  condition: and(succeeded(), eq(variables['Build.SourceBranchName'], 'master'))
  displayName: Deploy Production
  dependsOn: 
  - Build
  - deployAcceptance
  - deployTest
  jobs:
    - deployment: VMDeploy_Production
      displayName: deploy Production
      environment:
        name: Service Portaal VM productie
        resourceType: VirtualMachine
      strategy:
        runOnce:
          deploy:
            steps:
              - template: deploy.yml

And in your Azure Pipelines dashboard it should now look something like this. Some of the stages have been skipped here, because I didn’t want them to deploy yet.

This shows the deployment to the environments
This shows the runs that have been run
Here you can see the code coverage

Now you should have a pipeline in Azure Pipelines, with multiple deployment environment on self-hosted VM’s, using Node.js and Angular.
If you have any questions or suggestions, feel free to leave them below. I hope I helped some of you out!

The post Deploy Angular and Node.js webapp in Azure Pipelines (part 5) appeared first on AMIS, Data Driven Blog.
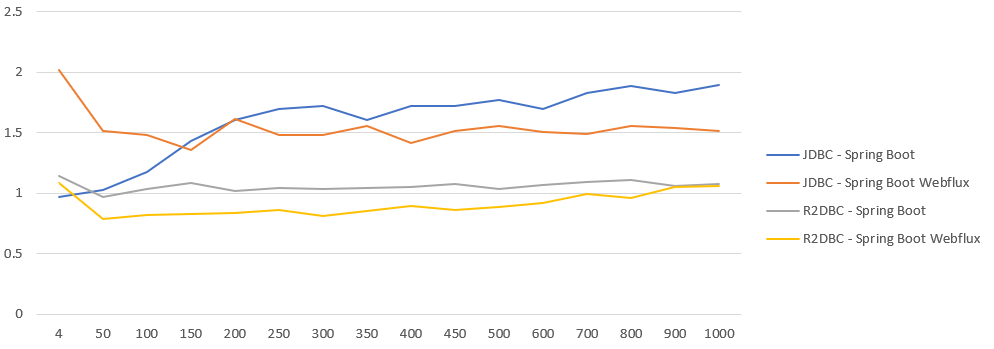
Apache Camel and Spring Boot: Calling multiple services in parallel and merging results

$
0
0

Sometimes you have multiple services you want to call at the same time and merge their results when they’re all in (or after a timeout). In Enterprise Integration Patterns (EIP) this is a Splitter followed by an Aggregator. I wanted to try and implement this in Spring Boot using Apache Camel so I did. Since this is my first quick try at Apache Camel, I might not have followed much best practices. I used sample code from Baeldungs blog, combined it with this sample of sending parallel requests using Futures. You can browse my code here.

Run the sample

First clone https://github.com/MaartenSmeets/camel-samples.git

Next

mvn clean package
java -jar .\target\simplerouter-1.0-SNAPSHOT.jar

What does it do?

I can fire off a request to an api-splitter endpoint with a JSON message. It then calls 2 services in parallel (using separate threads) and merges their results. The combined result is returned.

It is pretty fast; response times on my laptop around 10ms.

How does it work?

Two separate services are hosted to accept requests. The api-splitter and the api itself. Of course next to the api-docs which are in Swagger v2 format so you can easily import that in a tool like Postman.

Camel uses Components. ‘http’ is such a Component and so is ‘direct’. These components have their specific configuration. There is a REST DSL available to expose endpoints and indicate which requests are accepted and should go where. The DSL can indicate to which component a request should go. ‘direct’ components can be called from the same CamelContext. Here most of the ‘heavy lifting’ happens in my example. The from and to syntax for forwarding requests is pretty straightforward and the RouteBuilder is easy to use.

There is an object available to map the JSON request to in this example. You’re not required to map the JSON to a Java object but for processing inside your Java code, this can come in handy. The api-splitter calls a direct:splitter which creates two Futures do do the calls in parallel to the local api (which maps the JSON to a Java object and does some processing). The result when received is then parsed to JSON and the results from both services are merged in a single array. Below a small picture of how this looks.

Finally

A nice first experience with Apache Camel. I was having some challenges with TypeConverters and getting the body in the correct shape/type but beyond that the experience was quite good. It is relatively easy to use (in this small scenario), integrates well with Spring Boot and my first impression is that it is quite flexible. Also the default logging provides useful information on the service call stack.

Of course what I didn’t implement was a message agostic routing mechanism and I haven’t checked what happens when one of the services doesn’t respond; you want to provide a timeout you can do so in the HTTP Component. The code around the Futures will require some nice exception handling though in order to return a nice message if one of the calls fails and the other doesn’t.

The post Apache Camel and Spring Boot: Calling multiple services in parallel and merging results appeared first on AMIS, Data Driven Blog.

Microservice framework startup time on different JVMs (AOT and JIT)

$
0
0

When developing microservices, a fast startup time is useful. It can for example reduce the amount of time a rolling upgrade of instances takes and reduce build time thus shortening development cycles. When running your code using a ‘serverless’ framework such as for example Knative or FnProject, scaling and getting the first instance ready is faster.

When you want to reduce startup time, an obvious thing to look at is ahead of time (AOT) compilation such as provided by an early adopter plugin of GraalVM. Several frameworks already support this out of the box such as Helidon SE, Quarkus and Micronaut. Spring will probably follow with version 5.3 Q2 2020. AOT code, although it is fast to startup, still shows differences per framework. Which framework produces the native executable which is fastest to start?

If you need specific libraries which cannot be natively compiled (not even when using the Tracing Agent), using Java the old-fashioned JIT way is also an option. You will not achieve start-up times near AOT start-up times but by choosing the right framework and JVM, it can still be acceptable.
In this blog post I’ll provide some measures which I did on start-up times of minimal implementations of several frameworks and an implementation with only Java SE. I’ve looked at both JIT and AOT (wherever this was possible) and ran the code on different JVMs.

Disclaimer

These measures have been conducted on specific hardware (my laptop) using specific test scripts on specific though minimal implementations (but comparable). This is of course not the same as a full blown application running in production on specialized hardware. Use these measures as an inspiration to get a general idea about what differences between startup time might be. If you want to know for sure if these differences are similar for you, conduct your own tests which are representative for your situation on your hardware and see for yourself.

Setup

At the end of this blog post you can find a list of framework versions which have been used for my tests. The framework implementations which I’ve used can be found here.

Measuring startup time

In order to determine the startup time, I looked at the text line in the logging where the framework indicated it was ready.

  • Helidon SE
    WEB server is up!
  • Micronaut
    Startup completed in
  • Open Liberty (Microprofile)
    server is ready to run a smarter planet
  • Spring Boot and related
    JVM running for
  • Vert.x
    Succeeded in deploying verticle
  • Akka
    Server online at
  • Quarkus (JAX-RS)
    started in

I wanted to measure the time between the java command to run the JAR file and the first occurance of the above lines. I found the magic on how to do this here. Based on this I could execute the following to get the wanted behavior.

expect -c "spawn JAVACOMMAND; expect \"STRING_TO_LOOK_FOR\" { close }" &gt; /dev/null 2&gt;&amp;1

Next I needed to time that command. In order to do that, I did the following:

ts=$(date +%s%N)
expect ...
echo ADDITIONAL_INFO_ABOUT_MEASURE,$((($(date +%s%N) - $ts)/1000000)) &gt;&gt; output.txt

I did this instead of using the time command because of the higher accuracy and because of the way I piped the expect output to /dev/null.

Implementing a timeout

I noticed sometimes the expect command left my process running. I did not dive into the specifics as to why this happened, but it caused subsequent tests to fail since the port was already claimed. I installed the ‘timelimit’ tool and specified both a WARN and KILL signal timeout (timelimit -t30 -T30). After that I did a ‘killall -9 java’ just to be sure. The tests ran a long time and during that time I couldn’t use my laptop for other things (it would have disturbed the tests). Having to redo a run can be frustrating and is time consuming. Thus I want to be sure that after a run the java process is gone.

JVM arguments

java8222cmd="/jvms/java-8-openjdk-amd64/bin/java -Xmx1024m -Xms1024m -XX:+UseG1GC -XX:+UseStringDeduplication -jar"
java1104cmd="/jvms/java-11-openjdk-amd64/bin/java -Xmx1024m -Xms1024m -XX:+UseG1GC -XX:+UseStringDeduplication -jar"
javaopenj9222="/jvms/jdk8u222-b10/bin/java -Xmx1024m -Xms1024m -Xshareclasses:name=Cache1 -jar"
javaoracle8221="/jvms/jdk1.8.0_221/bin/java -Xmx1024m -Xms1024m -XX:+UseG1GC -XX:+UseStringDeduplication -jar"

The script to execute the test and collect data

I created the following script to execute my test and collect the data. The Microprofile fat JAR generated a large temp directory on each run which was not cleaned up after exiting. This quickly filled my HD. I needed to clean it ‘manually’ in my script after a run.

Results

The raw measures can be found here. The script used to process the measures can be found here.

JIT

The results of the JIT compiled code can be seen in the image above. 

  • Of the JVMs, OpenJ9 is the fastest to start for every framework. Oracle JDK 8u221 (8u222 was not available yet at the time of writing) and OpenJDK 8u222 show almost no difference.
  • Of the frameworks, Vert.x, Helidon and Quarkus are the fastest. 
  • Java 11 is slightly slower than Java 8 (in case of OpenJDK). Since this could be caused by different default garbage collection algorithms I forced them both to G1GC. This has been previously confirmed here. Those results cannot be compared to this blog post one-on-one since the tests in this blog post have been executed (after ‘priming’) on JVMs running directly on Linux (and on different JVM version). In the other test, they were running in Docker containers. In a Docker container, more needs to be done to bring up an application such as loading libraries which are present in the container, while when running a JVM directly on an OS, shared libraries are usually already loaded, especially after priming.
  • I also have measures of Azul Zing. However I tried using the ReadyNow! and Compile Stashing features to reduce startup time, I did not manage to get the startup time even close to the other JVMs. Since my estimate is I must have done something wrong, I have not published these results here.

AOT

JIT compiled code startup time does not appear to correspond to AOT code start-up time in ranking. Micronaut does better than Quarkus in the AOT area. Do notice the scale on the axis. AOT code is a lot faster to startup compared to JIT code.

Finally

File sizes

See the below graph for the size of the fat JAR files which were tested. The difference in file size is not sufficient to explain the differences in startup time. Akka is for example quite fast to startup but the file size is relatively large. The Open Liberty fat JAR is huge compared to the others but its start-up time is much less than to be expected based on that size. The no framework JAR is not shown but it was around 4Kb.

Servlet engines

The frameworks use different servlet engines to provide REST functionality. The servlet engine alone however says little about the start-up time as you can see below. Quarkus, one of the frameworks which is quick to start-up, uses Reactor Netty, but so do Spring WebFlux and Spring Fu which are not fast to start at all.

Other reasons?

An obvious reason Spring might be slow to start, can be because of the way it does its classpath scanning during startup. This can cause it to be slower than it could be without this. Micronaut for example, processes annotations during compile time taking away this action during startup and making it faster to start.

It could be a framework reports itself to be ready while the things it hosts might not be fully loaded. Can you trust a framework which says it is ready to accept requests? Maybe some frameworks only load specific classes at runtime when a service is called and others preload everything before reporting ready. This can give a skewed measure of startup time of a framework. What I could have done is fire off the start command in the background and then fire of requests to the service and record the first time a request is successfully handled as the start-up time. I however didn’t. This might be something for the future.

The post Microservice framework startup time on different JVMs (AOT and JIT) appeared first on AMIS, Data Driven Blog.

Viewing all 163 articles
Browse latest View live